Cycling Base Training Pathway - Fast Talk Laboratories

The Relationship Between Performance Level and Training Stress

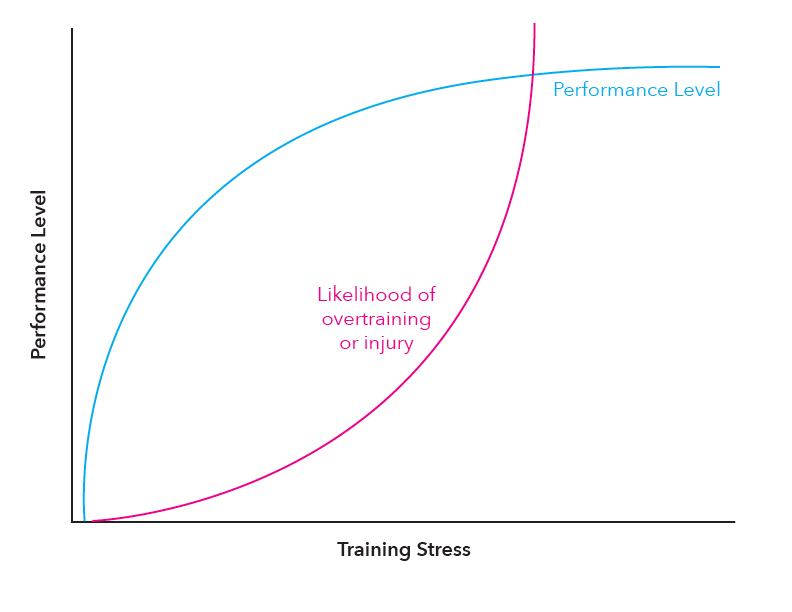
Eighty percent of what you need to know about endurance training can be illustrated by a simple graph. Coach Connor and his mentor Glenn Swan explore this simple concept.

Endurance Sports Training Performance Level versus Training Stress
Fig. 2: As training stress increases, so too does the likelihood of overtraining and/or injury.

A long time ago, after several false starts, my career as a cyclist and physiologist began over a few slices of pizza.

A good friend, Glenn Swan, had watched me try crazy idea after crazy idea to become a top cyclist. On several occasions, he offered to show me the most important thing I needed to know—a simple graph. I declined. And I have regretted it ever since.

My “brilliant” ideas that had no basis in physiology pushed me into such a severe overtrained state that I had to spend close to a month in the hospital and then two years getting to the point where I could ride a bike again.

Eventually, I was able to ride again, and this time I decided to take a different approach to my training—because I decided to listen. So, I asked Glenn to explain the graph again. He told me to meet him at the pizza shop, buy him two slices, and he’d show me everything.

What Glenn showed me was one graph. He attributes it to the legendary running coach Jack Daniels—and I have seen some of the pieces of the graph in Daniel’s Running Formula [1]—but Glenn had such a unique and understandable way of explaining the graph, that I will always see it as his.

After an hour and several slices, the lightbulb turned on and the graph became the foundation of my training. It was my “plan.” The next year I went from a Cat. 4 getting dropped at local races to a Cat. 2 with an invitation to train at the Canadian National Center.

Since then, I have received my master’s degree in exercise physiology, coached at the Center, run semi-professional teams, coached for two decades, and hosted a podcast on the principles of training. And, despite all that I have read and learned in that time, the graph has remained the foundation of everything I know.

One graph, many principles

At the heart of the graph is a very simple idea that is often misunderstood—I certainly had the wrong idea before my lightbulb turned on. What I believed, and many believe, is that there is a straight-line relationship between training and performance/fitness. In other words, the harder you train, the stronger you get.

That’s not the case.

The relationship is actually curvilinear (see Fig. 1). Initially, it takes very little training stress to see big gains in performance, such as at the start of the season or after returning from an injury. But, as your performance level improves, the line starts to level off and it takes increasingly more training stress to see even small gains:

Fig. 1: The relationship between training stress and performance level is curvilinear.

Put another way, if you increase your weekly training volume from 150 miles to 300 miles, your fitness is unfortunately not going to double. The improvements will be significantly less.

Eventually, any athlete will reach a plateau—no matter how hard they train, they won’t see any further improvements. But that’s not the only issue with training too much. There is another line—the likelihood of overtraining or injury. Initially, the likelihood is very low with low training stress. But as training stress increases, the likelihood increases (see Fig. 2).

Performance Level versus Training Stress
Fig. 2: As training stress increases, so too does the likelihood of overtraining and/or injury.

Eventually, with too much training, your performance will not improve and your chance of overtraining gets high. This is not a place you want to be.

Charting your season on the graph

What I also learned from Glenn is that the graph gives a simple visual of why experienced endurance athletes train the way they do in the base season and in the race season (see Fig. 3).

Fig. 3: Building a base and building race fitness.

Building a base

If you take a proper rest between your race seasons, your level will drop. Thus, when you get back on the bike in November or December, you will be at the low point on the performance graph. That’s unfortunate if you’re looking for a Strava KOM in December, but great if you’re ready to start rebuilding your fitness, since it takes little stress to see big gains. Easy rides and some volume will push your level up the graph rapidly. High-intensity, high-load workouts just aren’t needed during this phase.

Building race fitness

If you did your base work right, you’ll approach the season at 85 to 90 percent of your potential for that year (i.e. where the performance graph plateaus). Now, to see additional gains, much bigger training stress is needed. This is where high intensity work is truly needed.

Fortunately, while the work needs to be hard, months and months of very high intensity HIIT work is not needed. This is true for a few reasons. First, you’re only looking to get another five to 15 percent improvement, and that doesn’t take long periods of time. Second, the nature of the remaining physiological adaptations means they take place quickly. Most of the gains are seen in four to six weeks. [2–4]

Generally, an athlete shouldn’t try to spend very much time at 100 percent of their peak potential—where the graph plateaus—due to the risk of overtraining or injury. Peaking strategies try to take athletes to this point for short periods of time, coinciding with target events. But experienced athletes quickly pull themselves back and spend most of their season at a training stress where the potential of getting off course is low.

Mapping the season

For nearly two years after I learned about the graph, it became my “training plan.” I mapped out my season on the graph, knowing where I wanted to be at each point in my season.

Here’s an example of the graph I used in that first year when I upgraded to a Cat. 2 rider (see Fig. 4).

Fig. 4: You can use the graph to help map out your season.

The graph and base training

Each season, every rider has a point at which they plateau in their graph. Base training is so important because it sets the height of the plateau for the rest of the season. Here’s an example, showing an athlete’s genetic potential, where they can get to in a season with good base work, and what happens if they neglect their base work (see Fig. 5).

Fig. 5: Comparing an athlete’s genetic potential, their level if base training is appropriate, and their level if base training is inadequate.

In essence, base work sets the trajectory and arc of the vertical portion of the graph. Once you get into the season and start doing race fitness work, the graph will start to level off and head towards the plateau. Interestingly, once the graph starts to level off, research suggests that the additional “performance gains” are always the same regardless of where you start to level off. [5] In other words, once the graph starts to level off, the shape is always the same.

So, to a point, the more base training you do, the higher your potential plateau becomes. However, that does not mean you will win races if all you ever do is base work. First, you can’t reach your peak potential for the season without that plateau. Second, the top-end fitness that creates that peak is necessary to get over that one-minute climb, cover attacks, and win races.

So, be selfish with your base—make that phase long enough to allow a high plateau for that season. Cyclists who are impatient and hoping to come into the season strong commonly make the mistake of doing their race-intensity work in early February at the cost of endurance work. All they accomplish is to create a plateau well below what they could have reached. They end up spending the season at a lower level than where they could have been.

Two riders, two approaches

This point is best made by comparing two riders. We’ll use riders Bob and John, two athletes of comparable genetic potential and experience.

John decides this is the year to take it up a level. He works hard in the winter, spending hours on the trainer doing sprint and high intensity work. More than 40 percent of his time is spent at high intensity, with three to four interval sessions per week. By March he is trim, fit, and ready to go.

Bob takes a different approach. He spends February and March doing long, easy base rides. Interval work comprises about 10 percent of his total time and is focused more on threshold work. By March, he’s feeling decent but nowhere near his top form.

It may help to visualize both of these riders on the graph (see Fig. 6).

Fig. 6: Illustrating the differences in training approaches.

By mid-March, John is at point C on the graph while Bob is at point A. John’s level is higher and he’s beating Bob at the March early season training races. He’s looking strong and few riders can touch him. He feels rewarded for his hard work.

What he doesn’t know is that he has already begun his plateau, while Bob is still building his base. By mid-April, Bob has reached point B on the chart while John is at point D. John is no longer winning the races. Now he’s just struggling to hang on. Worse, the level at which he must train just to be competitive is intense. His legs hurt and he’s getting sick frequently. He finds he has to skip races. His performance is hit or miss.

Conversely, Bob is performing well now. He’s feeling fit, strong, and has a “full tank.” He’s consistent at every race and knows he has another level in him for a big race or two later in the season.

By June, John has disappeared. He shows up to a few training rides, tells guys he’s getting tested for mononucleosis. That’s the last time anyone sees him until September.

Why did this happen? John didn’t do enough base work and started his plateau way below his potential. By May, he had to be at his peak form just to be marginally competitive. However, peak form doesn’t last for long and will lead to overtraining if the rider tries to sustain it. The only thing left for John to do is rest and prepare a little better the following year.

Bob, on the other hand, used base training to raise his overall level. As a result, he could be competitive with the local riders without ever pushing the overtraining curve. This gave him the opportunity to push the training stress for a few weeks at targeted points and be unstoppable at his key events.

The graph changes year to year

It’s important for all riders, especially new riders, to remember that they have a genetic potential, and then they have a seasonal potential that will change from year to year. Just because a rider plateaus at one level their first year doesn’t mean that they will plateau at the same level the next year.

With a proper multi-season plan or vision, well-trained endurance athletes will always start the next season at a higher level than the previous season and be able to raise their plateau (see Fig. 7).

Fig. 7: Athletes can see greater improvements from year to year, assuming their training goes well.

Also notice that with each year, the potential benefits from base work decrease. High-level professional athletes can achieve a high level with a lot less base training than beginner athletes. This is their advantage.

The disadvantage for high-level athletes is that it takes a lot more work to see even small gains—gone are the days when they can go out for “coffee rides” for a few weeks and see progress.

It also means that high-level athletes must train at a much greater risk of injury or overtraining than beginner athletes over the entire season. This is why many athletes rise quickly through the ranks and then reach a point where they keep having “bad seasons” marked by injury and frustration. They’ve reached a point where, to see improvements, they can’t make the sorts of mistakes they got away with early in their careers.

Beginner athletes can make a lot of mistakes, train relatively poorly, and have a decent season. By contrast, at the highest levels, endurance athletes must train carefully with well structured plans.

This leads to a very important concept:

As you reach higher levels, the goal should not be to train harder but to train more intelligently—better choice of intervals and improved execution, more focus on recovery,and so on—so that you can train at a higher stress level and still avoid injury.

Your slogan should become: “train smarter, not harder!” Truthfully, you might consider doing both to reap the greatest rewards.

The graphs move independently

It’s important to separately graph performance and burnout because each attribute can move independently. The result is a very unique profile for each rider.

This is the reason a new amateur simply can’t train as hard as a seasoned Olympic endurance athlete. The Olympian, over many years of base development, has shifted their burnout curve to the right. So, that athlete can train at much higher levels without risking injury or burnout (see Figs. 8 and 9).

Figs. 8 and 9: Experienced endurance athletes are able to decrease the risk of overtraining and injury over time.

As an example, several interesting studies that looked at the impact of oxidative stress on elite and amateur cyclists found that amateurs were quickly overwhelmed as they increased their training stress.

By contrast, elite cyclists measured over the course of the Criterium du Dauphiné experienced decreases in their levels of oxidative stress. They produced very high levels of reactive oxygen species, but the natural defense systems they had developed were more than capable of handling the stress. [6–9]

Why an off-season is important

The fact that the graphs shift independently explains why it is so important to have an off-season. At the peak of the season, a rider tends to almost exclusively ride their bike. As a result, muscle imbalance starts to build, the systems used for cycling start to accumulate damage, and repetitive strain develops.

In short, at the peak of the season when the rider is near the top of their performance curve, the overtraining curve starts to shift to the left. This is why, by the end of the season, most riders are feeling flat even when they drop their training significantly (see Fig 10).

Fig. 10: The overtraining curve can shift left at the peak of the season.

During an effective offseason, several things happen. First, the body is given time to rest and recover. Second, experienced riders will cross train and hit the weight room—this will reverse the muscle imbalance and build injury resistance.

The result of the off-season is that while performance drops, the burnout graph will shift right again. Done effectively, it will shift further right than where it was the previous season and allow the athlete to train at a higher level once the race season rolls around again (see Fig. 11).

Fig. 11: An effective off-season helps you restart stronger and better prevent overtraining.

The simple graph that Glenn hit me with so long ago has served as a training template ever since. So many of the fundamental principles of exercise physiology can be explained through this illustration. Not only does it help athletes visualize the relationship between training stress and performance level, it helps construct a logical framework for the progress you should expect to see during any given season.

References

  1. Daniels J. Daniel’s Running Formula. The State University of New York at Cortland: Human Kinetics; 2004.
  2. Buchheit M, Laursen PB. High-Intensity Interval Training, Solutions to the Programming Puzzle. Sports Med 2013;43:927–54. https://doi.org/10.1007/s40279-013-0066-5.
  3. Laursen PB. Training for intense exercise performance: high‐intensity or high‐volume training? Scand J Med Sci Spor 2010;20:1–10. https://doi.org/10.1111/j.1600-0838.2010.01184.x.
  4. Coffey VG, Hawley JA. The Molecular Bases of Training Adaptation. Sports Med 2007;37:737–63. https://doi.org/10.2165/00007256-200737090-00001.
  5. Caritá RAC, Caputo F, Greco CC, Denadai BS. Aerobic fitness and amplitude of the exercise intensity domains during cycling. Rev Bras Med Esporte 2013;19:271–4. https://doi.org/10.1590/s1517-86922013000400009.
  6. Holloszy JO, Coyle EF. Adaptations of skeletal muscle to endurance exercise and their metabolic consequences. J Appl Physiol 1984;56:831–8. https://doi.org/10.1152/jappl.1984.56.4.831.
  7. Serrano E, Venegas C, Escames G, Sánchez-Muñoz C, Zabala M, Puertas A, et al. Antioxidant defence and inflammatory response in professional road cyclists during a 4-day competition. J Sport Sci 2010;28:1047–56. https://doi.org/10.1080/02640414.2010.484067.
  8. Aguiló A, Tauler P, Guix MP, Villa G, Córdova A, Tur JA, et al. Effect of exercise intensity and training on antioxidants and cholesterol profile in cyclists. J Nutritional Biochem 2003;14:319–25. https://doi.org/10.1016/s0955-2863(03)00052-4.
  9. Lewis NA, Towey C, Bruinvels G, Howatson G, Pedlar CR. Effects of exercise on alterations in redox homeostasis in elite male and female endurance athletes using a clinical point-of-care test. Appl Physiology Nutrition Metabolism 2016;41:1026–32. https://doi.org/10.1139/apnm-2016-0208.