Dr. Stephen Seiler explores whether a Zwift race of about 60 minutes can be a decent substitute for a 60-minute FTP test.
Video Transcript
Dr. Stephen Seiler 00:01
Hi, this is Dr. Stephen Seiler. In this video I want to talk about a subject that’s near and dear to the heart of most, most exercise physiologist, but most endurance athletes as well if they’re willing to admit it, and that is fitness testing. The idea of testing your fitness through some kind of, either laboratory test or field test, to assess where you are and whether you are making progress, ready to race and so forth.
Fitness Testing
Dr. Stephen Seiler 00:31
Now, my interest in fitness testing and my interest in training has really increased in the last few years, because I finally got back to training in a serious way after a leg injury and some health issues that forced me to realize that training was fresh fruit and sitting on my butt all day as a university leader was not good for me. So first, I started by remodeling my house a bit, setting up a training facility, training room upstairs, and I bought a Concept2 Ski ergometer, used that for about a year, and then I bought a Concept2 Cycling ergometer, and started cycling on the bike, or as it’s called, and in, if you start, if you start using the Concept2, either rowing machine, or bicycle, or ski ergometer, they have these rankings, these World rankings that you can use, and kind of see where you stand.
Hour of Power Test
Dr. Stephen Seiler 01:37
So pretty soon, I started doing different tests, and particularly I did the 60-minute or Hour of Power Test. Now this is in cycling, this is a famous test, that’s where it gets the name, the Hour of Power on the track, but it’s also been used in research in the laboratory, it forms the kind of foundation for the functional threshold power concept, and so forth. But doing a 60-minute test as hard as you can, and just hanging on and going hard, and suffering, well, that’s where it is it’s suffering, it’s no fun. You get good information about yourself, and about your fitness, but it’s not a lot of fun to do. A well-executed, one hour test is basically just starting at the right goal pace and hanging on, holding it for minute by minute by minute, it feels worse and worse and worse, but eventually, if you get to the end, and you have anything left, you empty the tank at the end, and that’s your 60-minute power.
Dr. Stephen Seiler 02:44
Okay, so that’s good, but it’s boring, and more recently, I’ve switched to the platform Zwift, which is just a whole different world in terms of interactivity, and, you know, that in particularly in recent times, there’s been a lot of some of the best cyclist’s triathletes in the world that have been using the Zwift platform, along with bazillions of others, all in all shapes and sizes and abilities. So, on any given day, at any given hour, you can find all kinds of different workouts, group rides, training sessions, races, every hour, there’s two or three different races to choose from, I would guess.
Is Zwift a Good Measure of Fitness?
Dr. Stephen Seiler 03:28
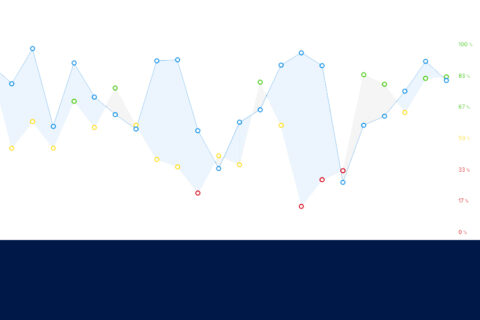
So, one question then becomes in that kind of environment, then you have another problem, which is it’s, it’s you know, it’s much more fun to do a race or something like that than it is to do a test. So does the Zwift race of the appropriate duration, after a while you start learning what races to take how long, you have 20-minute races and 40-minute races, and roughly about 60-minute races and so forth, and you can key in on the duration, you’d like to test yourself, and then the question becomes, well, are these races, are they reasonable estimates are reasonable replacements for a good sit on the bike by yourself test? Well, to get at that, I’m going to look at a few races that I have done using this program called Endura. Now it’s in a beta testing phase now, and John Peters and I have been working on this for quite a few months, and he and I have worked together on several different applications for analyzing sports related and training related data. He’s a Welsh veteran runner, so he’s easy to talk into playing with sports data. He’s helped tremendously, he’s made this possible to create this Endura program that I use to analyze training sessions and races, in a in a fashion it’s a bit different maybe than most, because I’m interested in what happens across the time course of a race or training session, and how durability and high intensity repeatability improves over time with training. So, I save sessions on this platform, on our analytics platform, and I save races usually. So, I’m going to take three races that are similar in duration, but quite different in just the nature of the conditions, and we’re going to compare them, and look at power output. So, I picked three, I’m going to compare multiple sessions. Now, those three sessions have been picked out for me, I’m going to show you what they look like in the raw format, this is just the straight data, the power data, and they haven’t been cleaned up in any way, here we are.
Dr. Stephen Seiler 05:55
So, here you see the warm-up is there, this is actually on a separate part of the Zwift course. So, I attached these two files, and this is the cool down, these other two races have, the start is clean, but they have a bit of a cooldown here, before I end the session. So, this is a bit messy, you can’t really analyze it yet, you need to clean up the files, and I’ve already done that, I’ve stored it as a separate analysis. So, I’m going to go to saved analysis, and then I’m going to pick one that is called, different kinds of 60-minute FTP races, it’s those same three. Now, that job of trimming the files has been done, and now you’re going to see what that looks like. So, there you go. Now you can see, this app Zwift is basically uphill, you know, it’s kind of a simulation of a long hard climb. And it ends up being basically a time trial, and very similar to the conditions of a 60-minute power test. The other two are races where you’re in a group, the group dynamics are happening, and every little incline that’s on the course, whether it’s a single loop or multiple loops, those will be targets for surges by the strongest most powerful riders, trying to call out or thin out the group slowly, fast if you can, but slowly if you must, until you get to the end, so you have fewer people to compete against at the end. So that’s the nature of Zwift racing, there is no dead time in these our races, it’s all every minute is pretty much either recovering from, or getting ready for, or doing some surge to get rid of people in your group. It’s a doggy dog world. So those are what those different races look like very different power application.
Different Average Power in Three Zwift Races
Dr. Stephen Seiler 08:00
But the question is, first, we’ll take this down. The first question I want to ask is, what is the average power for those three races? It was, you see, 58 minutes, 52 roughly, and 59 roughly minutes. So pretty similar here, and even this, this Zwift race had a seven-and-a-half-minute lead in him, at about 275 watts or so. So, it was it was very similar in actual workload here or time of effort, and so now you see 306 watts, 304 watts, and 300 watts, so very tight average. As a scientist’s, testing someone three times with exactly the same test in the laboratory, 60-minutes go as hard as you can, I’d be super pleased with that degree of repeatability of the test, that’s 1% plus or minus, from an average of about 303 watts. But if you look a bit more closely, we see that if you use the normalized or quad power here, the normalized power, it’s quite different, the peak powers are different, and so there is in you saw the power output, so there are some differences that are interesting. I want to take this data and I want to look at it a different way.
Responding to Surges in Zwift Races
Dr. Stephen Seiler 09:24
Now I’m going to peel off just the high intensity component, which I’m going to define as the work above red line, and that red line I’ve chosen is my 20-minute power. I have good data on what my best 20-minute power is, it’s currently 335 watts. Now, that I could choose critical power in this program, I could choose 60-minute power, I could just put in a power output that I wanted to use as a red line. So, I could do different things, but I’ve chosen my 20-minute power. Now I get a picture of that distribution of work above the red line in kilojoules, just like the anaerobic work capacity, or W prime in the critical power construct. If we look more closely at this data, I’m going to just zoom in here, just to show that, in this race, this Norwegian Grand Prix, which was an age group race, that I jumped in, just on the spot, because I saw the name, in this, it was eight laps of the volcano circuit, which has a distinct, short steep climb each circuit, plus another small incline. But at any rate, it resulted in some predictable surges, where the top riders were really trying to get rid of everyone they could, and the the group went from about 60 or 70, and down to 45, and then 30, and then 18, and so forth, and I sat when I was 12, I was still in the group, the lead group, but then I was the number 12, that got dropped, or 11, or 12, somewhere in there, at the very end in the last lap. So, they got me too. For most of the time, I was responding to all of these surges, and they are deeper, or you might say, bigger percentages of my anaerobic work capacity, then those spikes that you see in the in the other race, which were perhaps more frequent, but of a different duration. So, this gives you an idea of how these races unfold. Despite this irregularity in the power, the average power is very similar for me now, I think part of that’s a training issue. Now, if we look at this another way, I’m going to go ahead and use this function compared labs, and now I’ve set up 10 equal laps based on percent of total time, and I’ve asked for the variable work above red line, and it’s in kilojoules, it’s the total and kilojoules for each time segment. Now you can see that in this race, there’s a front-end loading with a back-end sprint, so it’s a U-shaped distribution, quite typical for these kinds of Zwift races, versus this is war of attrition with very flat, repeated surges of in utilization of, you might say the anaerobic work capacity recovering on the fly. Then here you see me basically dying and not really having anything at the end to give, because I got dropped and lost my will to live or motivation, and there really wasn’t much room to do a sprint or will much reason.
Dr. Stephen Seiler 12:56
So, that’s what these look like and they all seem to take you to about the same place in terms of average power, at least me after some training that’s helped me to become better at the high intensity repeatability part. And if I do one more thing and show you the percentage of maximum heart rate response to these three different races, and I can change the scale. Now you see that the app of Zwift, kind of time trial scenario is just classic heart rate, drifting up towards max the whole way, versus more undulation in the Grand Prix race that race with distinct climbs, but all three take me to about the same place, which is about 95%-96% of maximum heart rate.
Dr. Stephen Seiler 13:57
So again, some power variation, but it suggests that if the duration is the same, and the effort is the same, and the surges you do are not too big, so that you basically fall apart, then the average power will probably end up being pretty similar and is a fairly reasonable indicator of your fitness and fairly reproducible.
Dr. Stephen Seiler 14:24
So, with that I will end and wish you good training.