Coach Ryan Kohler discusses why a pacing strategy for climbing is so critical and shares the best ways to create your own pacing strategy based on several possible metrics.
Video Transcript
Ryan Kohler 00:00
If you’re looking to PR your local climb, there’s usually this temptation to go out a little bit too hot, but what happens is were left burnt at the end. In today’s workshop, we’ll look at some examples of good pacing strategies and poor pacing strategies, and we’ll talk about the metrics that are important so you can analyze your files or your athletes’ files to optimize your pacing strategy.
Intro 00:30
Welcome to Fast Talk Laboratories, your source for the science of endurance performance.
Flagstaff Mountain: The Iconic Boulder Climb
Ryan Kohler 00:39
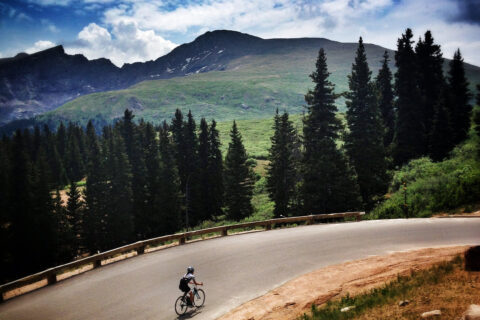
So, Flagstaff Mountain here in Boulder, Colorado, is an iconic climb. As you can see, here, it goes straight up Flagstaff Mountain, and it gains about 2000 feet of elevation gain over just four-and-a-half miles. It’s a pretty pitchy climb, so that’ll make for a really interesting analysis here with our power files. So, what I’ve done today is broken this climb up into four different segments for our power analysis. Down in these lower slopes is all segment one, and as we go up here, through these different switchbacks, we’re going to have some changes in terrain, some steeper segments around the switchbacks mixed in with flatter terrain. As we get up to this last big switch back over here, at Ute Spring, that’s the landmark we’ll use; that’s going to be the stopping point for segment one. Then as we travel above this section here, we have some longer straightaways that are going to take us up to an area that’s affectionately known as The Wall. So, this will be a pretty critical area to look at, and then you’ll see this little jog in the road here as we get higher up. That’s your approach into The Wall. The Wall here is this really straight section here, the average grade of Flagstaff overall is about eight-and-a-half percent, but when we get up to this wall section, we reach a maximum grade of about 15%, so we have a lot thrown at the riders. Finally, once we get above the wall, we get on this ridge, and we have a last little switchback that takes us up to the top, that’s where it flattens out a little bit, but again, as with the rest of Flagstaff, it’s a pitchy climb overall, where we’re faced with moderate grades and steep grades.
Breaking Down the Flagstaff Climb
Ryan Kohler 02:09
Alright, so let’s break this climb down. Starting at the bottom here, we have, like I said earlier, all of our switchbacks leading us up to this first point, which is that Ute Spring, from the start to this, I’m going to label as section number one. Then we have this long stretch with some varying terrain that’ll take us up to The Wall right about here, this is what I’m going to call segment two. We have this short wall segment, which is that 15% grade stretch, and I’ll call that section three. Then the final push to the top is section four. So, having ridden this a lot, I’ve chosen these based on kind of the expected power production through there, where the different challenges are, where we can ride harder and easier, and this is just my personal way that I would assess a climb like this, you can do it completely differently if there are particular areas you or your athlete are working on, but with the athlete, I’m working with these just made a lot of sense to us to break it up this way.
Ryan Kohler 03:03
So, we did this over two days. So, this is day one, we’ll look at this first, and then we’ll look at day two, and the whole goal here is to analyze what happened on day one. Even though this was a good performance, we still found areas that we can improve upon. So, the goal for day two was to create a pacing strategy that would help us further improve on this initial PR that was created. So, as we break these segments down, this is going to be our start, and then from here, all the way over to about here is section one, we have this other segment, that’s going to take us up to The Wall, right here in segment two, we have The Wall itself, segment three, and then we have our final push to the top for segment four. So, this is how we’re breaking this down and segmenting it. This is a lot different now when we’re looking at all the power and cadence data versus the map. So, let’s talk about what we have here first, the red line up here, this is your heart rate, we have purple, you can see all these jagged lines up and down here, this is our power output, and then in here we have these yellow lines, that’s indicating cadence, down here in the green, we have speed, and finally we have the grade here in gray in the background.
Power and Heart Rate at Different Segments
Ryan Kohler 04:19
So, let’s start off. What do we look at first? Well, we know with Flagstaff, if we broke this down and looked at the different gradients, we have sort of a pitchy climb. Even though this doesn’t really give us much sense of that, this just looks like one steady climb, but having ridden this before, there’s a wide variability in the actual grades we get. So, we wanted to look at first what kind of powers and heart rates are we putting out at different segments? So, for this first segment, we had an average of 229 watts, and we averaged 183 beats per minute, and we maxed at 188, and I’ll just put the “B” for beats there. Now for the second segment from that Ute Spring approaching the wall, what we had was 202 watts, and then we had 181 beats, with a max of 185 beats. Then we get to this wall section, and this is where we averaged 214 watts with a heart rate of 187 and a max of 190, and there are our beats. Then the final one, we had 212 watts, with an average heart rate of 186 and a max of 191. So, this last thing I’ll mention here is this black line you’ll see traveling across here is this riders’ threshold power. So, now we have all the data we need, we have this horizontal line indicating their threshold power, we have these numbers from the segments, and now we can start to pull this apart to make our assessment.
Functional Threshold Power
Ryan Kohler 06:01
So, let’s start with segment one. What we see here is a lot of power spikes initially, and on climbs, this is where it can be easy to go too hard out of the gate. So, when I first look at a file like this, I see that yeah, this rider went out hard, and it almost seems like there’s some nervous energy here, which is pretty typical for a big climb like this. So, if we break down roughly the first four minutes, we see here that this rider spent a lot of time well above threshold. These first four minutes were about 126% of threshold power, that’s big. Knowing that this whole climb took our rider about 44 minutes to complete, four minutes at 126 plus percent of FTP is going to put a big strain on the body and make it difficult to recover from. We know this, this climb doesn’t really let up very much. So, then if we look at the next four minutes, roughly, we still see that there’s a lot of power spikes up here, right? We still had a very high percentage of our FTP. We’re back in the one-teens at this point, but what’s the big takeaway here? Well, we see a lot of power spikes initially, and then what happens is these spikes start to get a little bit lower, and lower, and lower, right? All the way up till the wall. So, what this is telling me is that we went out a little bit too hard, sure, we made the whole client, we PRed it, which is great, we see this heart rate response being sustained nice and high, we know the rider went hard, right?
Improving Pacing Strategy
Ryan Kohler 07:24
The question is, can we improve on this pacing strategy to actually give the rider the opportunity to go appropriately hard early on, so we don’t burn through too much of that energy and not have much left for later? So, I see this general kind of downward trend in the power, and by the time we’re about halfway up the climb, well, now we see a pretty appropriate response where we have a little bit of time spent above threshold, a little bit of time spent below, and this is in response to those undulations in the terrain, as it gets steeper will require more power, as the grade declines a little bit and we can recover, then we see these power drops and we see cadence increase, and that’s likely happening around those switchbacks. So, we take this up through the approach to The Wall, and then up here we have this wall, and we know we’re at it because what happens is you can see this high cadence, right? For this rider, here’s our cadence, 60, 70, 80, 90, rpm in yellow, and we can see for this rider, they’re spending quite a bit of time in that like 70 area to start when the typical cadence for this ride or climbing is more like in the 60s. So, even knowing that about yourself or your rider, we can say, well, I’m above my typical cadence, what does that telling me about how I approach the climb? Then we see that cadence start to fall off, and once we get to The Wall, a great indicator to know that we’re there, because we can’t really tell from the grade, but we see, oh, look at the cadence, it’s really dropping down, now we’re in the 40s. So, we know we’re on a steep section of the climb, because we have this low cadence, and these big power spikes telling us that we need that to get over those 15% maximum grades. So, we get over The Wall, then we get up to this last stretch, and this I thought it was really interesting because we have these 2, 3, 4, 5, power spikes, where there are just these big pushes, what something like this tells me would suggest about a climb is when I see a large initial power surge like this a decline, and then I see some big chunks of time spent below threshold, but then at the end, I see big power spikes interspersed with very, very low power numbers, it tells me that the writer is being very responsive to the terrain and maybe not riding their effort anymore, but they’re riding the effort that’s dictated by the terrain itself. So, when we have to go harder, when we can pedal hard, we get on the gas and push, but then we don’t have a lot of energy, so we have these low power numbers, where there’s this huge variability. When I looked at this in more depth, what I found is the difference in power between the peaks and those lows was about 250 watts a little above that. So, it’s a wide range of power that we’re working on, where we’re on the gas, but then we can’t sustain it, and then we’re way off the gas because we need to recover.
Reducing Time and Creating a New PR
Ryan Kohler 10:01
So, from here, what do we need to do to help improve this, and ultimately, the goal is to reduce our time and create a new PR. Lastly, let’s look at this heart rate line. When we look at this, just as a cursory overview, we say, oh, yeah, this rider went hard the whole time, we see that they’re well pegged. Here’s the 175 mark, so we know yeah, they’re easily up in the 180s. We see these averages up in the mid-to-upper 180s, and then I see the peaks at 188, 185, 190, 191. So, this tells me this rider finished pretty much close, or right at their maximum.
Different Approaches to Having a Lower Heart Rate Response
Ryan Kohler 10:35
So, the other question I have as well, you know, we see some variability in the heart rate here, but can we approach this differently, where we have a little bit lower heart rate response initially, to sort of save that energy and more evenly pace our approach? So, that’s what we’re going to look at to help inform this next day when we go back out with a new pacing strategy. So, let’s look at day number two. Now, we see a vastly different profile, same exact climb, same exact metrics, heart rate, power, cadence, speed, and our climb in front of us here, but wow, this looks completely different from day one. So, if we go over here, and we look at the start again, we see here’s where our climb began, we have this initial power spike, and that’s where the road initially pitches up. So, we have an initial power spike much, much lower than what we saw on day one. So, the whole goal here with this rider was to figure out well, what’s sustainable? So, we needed to know their sustainable power, we still have that threshold to know what’s possible, but when we looked at day one, and we saw what you’re spending, you know, the first four-to-eight-minutes well above threshold in the one-teens to mid-120s, that’s going to take a lot of energy, and not give you what you need here. We know for a 40 plus minute climb, if you go out too hard, you’re going to waste that energy early on, and then it’s going to be a fight to get to the top, what we wanted to do is have a more even pacing strategy, so this rider can then adjust, especially when we get to The Wall and finish strongly. So, in the end, we ended up bringing time down by a couple of minutes, which gave us that PR, and I want to show you why here. So, if we look here, we already said these power spikes are much, much lower, right? These are only going near 300, not even getting over 300 watts in there, so very, very tight control around that threshold for the first few minutes. The other thing we’ll notice is to look at this heart rate response, much lower, we still see that variability in it, but again, here’s our 175 line, and we’re much closer to that here. So, we didn’t start off with this big full gas effort where heart rate is now pegged, and now we’re just trying to sustain and essentially recover from the initial effort that we did. So, if we take this first section again, and we look at the power output here, for day two, what we have is 221 watts, with an average of 176 beats, and a maximum of 185 beats, right? Then we take this section out to The Wall, that’s section two, and here we have 234 watts, with an average heart rate of 181 beats, and a maximum of 185. Then we have our section here of The Wall, that’s segment three again, so this is 222 watts, with an average heart rate of 187, and a maximum of 190. Then we have that final push up to the top again, and for that one, we have 243 watts, with an average heart rate of 192, and a max of 196. So, quite a bit different in terms of what we’re seeing here. Okay, so when we look at these, and we break down these four segments, again, we see some dramatic changes. So, we spent initially on this first segment, much less time at a very high percentage of threshold, we shouldn’t be going over threshold for an uphill TT, but it’s just how much is the question. So, for every rider, that percentage above will be a little bit different. What we did with this rider is said, “Okay, let’s just take instead of 126%, let’s bring that down to a more manageable level, 221,” now we’re not that much higher above threshold, this threshold for the rider was right around 200, much more manageable level to be at 221 with very few spikes above 300 watts. So, then what we see is as we get into this middle section leading us into The Wall, what we actually have is a nice increase in power there, 234 watts is what we see. So, now what this tells me is this rider is parceling out this effort much more consistently, and we see that reflected in the heart rate, these first two segments. This first one, which is a huge chunk of the climb is where we kind of make or break ourselves. We had a much lower heart rate 176 beat average, much, much lower than the first one. Then what that allows us to do is as we progress through here, we see that yeah, we still get that heart rate back up into the upper 180s, and we still max out in the 190s, but you can see this gradual upward trend in the heart rate, as the rider parcels out the effort, and then we finish with a nice strong effort up here. This is what I really like to see, there’s this big spike at the end, and this heart rate kicks up, plateaus, and kicks up again, and this is where we reach our peak. So, that tells me that, at the end of this, you did what you’re supposed to do throughout, and now you’re still finishing strong. What we could have done is actually have this rider probably go a little bit harder throughout here, 510 watts in certain areas here, and that would further reduce the time, and then allow for this kind of surge at the end to be a little bit spread out more evenly on the climb. Now, if you’re doing this as a single effort, where it’s just trying to get a PR and you ride steady, this works great. If you’re doing this in a race instead, we would want to look at these different sections and maybe break them up differently to say, “Okay, well, if I’m more of a punchy rider, where do I want to have an effort like this, that would give me the biggest benefit?” Maybe it’s on The Wall in this area where we have the steepest grades, maybe it’s early on if you’re more of that diesel engine, and you can ride a strong effort down here, maybe we parcel out more effort throughout, and then we get through The Wall and then finish strong. So, where can we just take that time from others? So, again, think about your approach when you’re planning these out.
Day One vs. Day Two
Ryan Kohler 16:19
So, let’s look at these now together, we’ll stack them just to kind of visualize the differences again. So, here’s day one, here’s day two, and right here, we can see just such a dramatic change. In day one, here’s our threshold line again, look at all of these peaks, very, very high power, which is going to zap us in energy, we’re going to break down a lot of that glycogen, and we’re not going to have as much left when we go toward the top, we see this gradual kind of downward trend in power, and then when we get to The Wall in the last segment, there’s a lot of these spikes where were just surging and fighting to get to the top, right? Now if we compare that to day two, we look here at the beginning, very, very different from day one, just look at the amount of the spikes that we get in power, and the height of them too, much less time above 300 watts. So, what does that mean? Well, then we get into this middle section, this is what I love to see, we can see there’s a good chunk of time, all the way through here, that we’re spending very consistently above threshold, so we’re no longer battling the terrain here, but what we’re doing is parceling out our effort, by changing our approach. One of the things we did with this rider to change the approach is just mentally say, “Hey, let’s just start off slower.” I love using cadence for stuff like this, to say, well, you don’t want to be in the 70s and 80, because we know power is going to go up, and that’s going to drive your heart rate up, so we said let’s bring your cadence down, just take it as a very chill approach. So, we did that, we see fewer cadence spikes, we actually got a lower cadence on average, initially over the first half of the climb, and that worked well, it allowed this rider to control the power, control the heart rate, and ultimately have more left at the end. Now, here’s the really cool thing, at the end, from The Wall to the top, we see huge spikes like I said, we’re battling the terrain, down here in this last section, this is really cool, look, we spent the majority of that time above threshold, this tells me that this rider had more in the tank, we could have gone even harder, but this was a huge success compared to day one.
Ryan Kohler 18:21
So, it goes back to looking at which pieces of the data help inform your approach. For us, it was mentally that piece of let’s just go slower, maybe let people go for riding with them, but let’s pick something to look at. So, for us, it was cadence, that’s the easiest thing to control, and we just said, “Hey, let’s spin slower.” Instead of looking and seeing 75 RPM, see 60-65, and that’s enough where that can just help you ride that line and control your effort.
What if You Don’t Have Power?
Ryan Kohler 18:47
Okay, the big question is, what if we don’t have power? Always use heart rate, it’s almost impossible to do this without something, right? We can go by feel, speed, but I really, really like to have heart rate, and this other metric I pulled out is VAM, or Vertically Ascended Meters. So, simply what this is, is just a rate of ascent, it tells you how many meters per hour you’re climbing. So, the fitter you are, the higher your threshold, the higher your sustainable power, the quicker you’re going to climb. So, if we don’t have a power meter, and I’ll do this with athletes on the mountain bike where fewer of them have power meters on there, so we’ll just use Vertically Ascended Meters because this uses speed over your distance to calculate that rate of ascent.
Breaking Down the Four Segments
Ryan Kohler 19:28
So, here’s what we’re doing is breaking down these four different segments. So, in blue, we have the start to the Ute Spring, and then we go to the Ute Spring to The Wall in the orange, then we have in gray, The Wall itself, and then in yellow, we have The Wall up to the finish. So, here’s day one, and here’s day two, right? So, we really don’t need power, but if we have heart rate we can look at what’s that physiological response that the body’s giving us into whatever we’re putting out, if it’s power, great, if it’s climbing speed, perfect, we don’t need power for that. So, we look at day one, you can see this rider is going out climbing pretty darn fast, 802 meters per hour is how we look at this. Day two, we slowed things down, not by much, we’re still almost 800 meters an hour, but this was just enough to turn that effort down slightly to give the rider a little bit more in the tank for later, right? This is interesting because we get up here and we say, all right, here’s the first part, then we have the second part that takes us up to The Wall, about 729 meters per hour on day one, well, that decline would suggest to me that maybe this rider is a little tired, maybe we went out too hard, because we have this initial surge we settle in, and then we know The Wall is going to require a lot of effort anyway. So, we see that but we have to compare it to something.
Climbing Takes a Combination of an Optimal Mindset and an Optimal Pacing Strategy
Ryan Kohler 20:46
So, looking from day one to day two, here on segment two, we have 729, maybe the riders tired. Now, if we go and switch over to day two, we started a little bit slower, but look at this, this long section in between with the run into The Wall, we were climbing significantly faster than on day one, because we have more in the tank. So, this really confirms that this is an appropriate pacing strategy for this rider on this climb. Now when we get to The Wall, this rider is still pushing hard up here, right? Like I said, The Wall demands a lot from you, so we were pushing a certain effort there, but look at this, on the second day, when we came back to do it again, we were climbing a little bit slower on The Wall, which is fine, because we expected that these initial areas were a good place for this rider to make time, right? So, we could afford to control ourselves here, maybe lose a little bit of time what we saw is we actually still gained a little bit overall. So, then we switch back to day one on this final push to the top, we see that 815 meters per hour is what we’re climbing at, and then afterward, we see this huge jump on day two to almost 870 meters an hour. So, the way I see this is too hard, we had to control ourselves and recover a little bit here, we dug in hard to do what we could, and then we ended up going relatively slower in the end. So, by changing that pacing strategy and saying alright, well, let’s go a little bit lighter to start, now we have this large chunk of road in the middle where we can climb at a pretty good pace, we can control ourselves through here, these really aren’t all that different, but then when we get to the top, and we have that last push, big, big difference there. So, this is a question of where can we make up the most time and how do we pace ourselves to do that.
Ryan Kohler 22:28
As you can see, climbing takes a combination of an optimal mindset and an optimal pacing strategy. Now you have some tools that you can use to look at your numbers and then go tackle your local climb to get that PR.