An Introduction to Training Metrics, Part 2

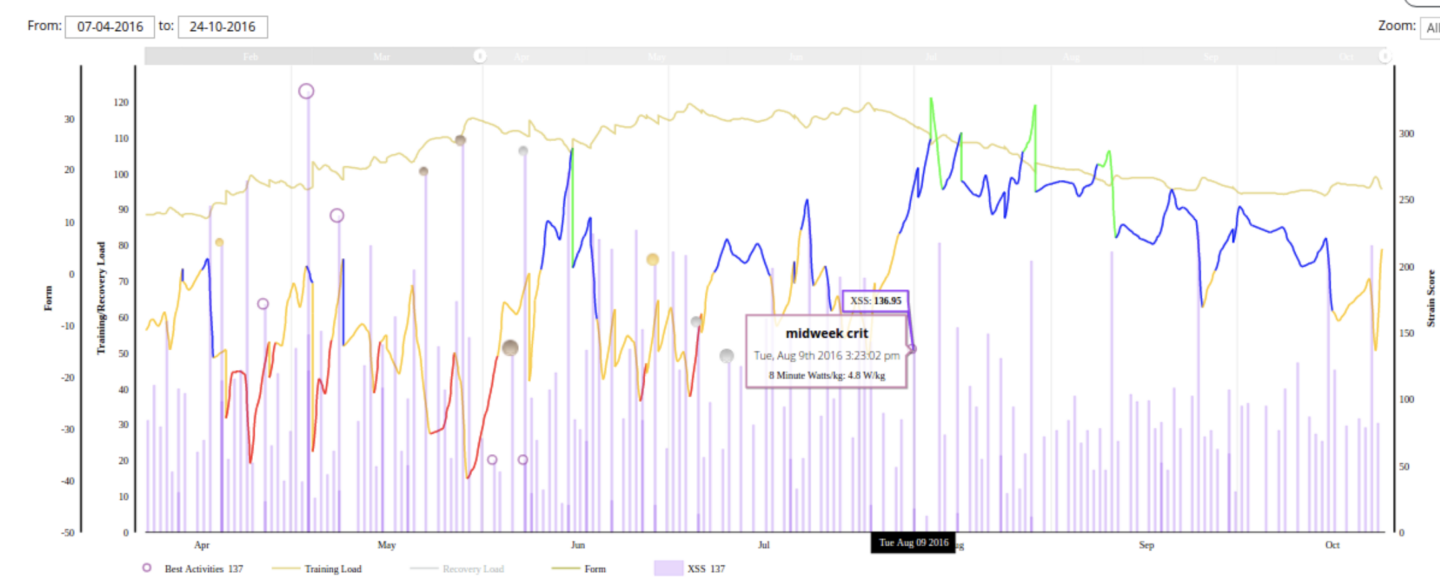
The interrelationship between form, fitness, and fatigue is the basis for quantifying training load. Performance Management Charts help athletes visualize and interpret that balance. Coach Trevor Connor explains the science.

Xert's version of the PMC

When he was racing in the 1970s, my first mentor, Glen Swan, kept a poster-size chart on his bedroom wall to track his morning heart rate. As he explained to me, back then having such an advanced metric gave him a competitive edge. Those were the days.

Now, it seems every detail about an athlete can be charted, graphed, analyzed, and explained to a dizzying level of detail. Has it ever made you wonder about the depth of the science behind this information?

In fact, tools like TrainingPeaks, Golden Cheetah, and Xert contain many metrics for assessing your fitness that are so cutting-edge, researchers are now using them in scientific studies. [1]

Collecting training data and attempting to analyze it began with a few scientists. The first attempts to calculate performance go back to Dr. Eric Banister in 1975. [2] He started with a simple formula:

Performance = Fitness – Fatigue

Banister’s work laid the foundation for a field of research known as the Systems Model approach to quantifying training. Other noted researchers such as Thomas Calvert and Thierry Busso added to the complexity of the formula to account for factors like individual differences and for the fact that, while the models are linear, physiology is not. For example, the fatigue generated by a single training ride is affected by how hard the athlete trained before that. [1,3–5]

But one thing that has not changed since 1975 is the core of every model: the interrelationship of performance (or form), fitness, and fatigue.

Predicting performance

There was a powerful motivation behind this research. Scientists felt that if they could accurately model performance, then they could explain the reasons behind any changes in performance. In other words, they could explain why an athlete performed at his or her best or, conversely, why he or she didn’t when expected to do so.

Dirk Friel has worked with many riders, including many pros, who collect their data from every ride but don’t know how to interpret it. “They haven’t looked at it through the lens of the trends over time,” says the founder of TrainingPeaks. Friel has found that when he shows them the trends it can take them to a new level of performance.

A centerpiece of the TrainingPeaks software is the Performance Management Chart (PMC). Created by Dr. Andrew Coggan and Hunter Allen, the chart draws on decades of Systems Model research and, at its core, is based on Banister’s formula. “Everybody intuitively does it,” Friel says. “Fitness, fatigue, and form—that’s what we’re trying to manage to prepare for an event.”

Ultimately, the ability to assess our form is what we hope to gain from our training data. But, as we’ve previously mentioned, that form is a function of two other factors: fitness and fatigue. For example, you need good fitness to perform, but even if you have great fitness, if you are also very fatigued, you still won’t have the form to perform well.

Quantifying load

To interpret the relationship between the three attributes—fitness, form, and fatigue—there needs to be an input. In short, something needs to be measured. Researchers have focused on quantifying how hard a training session is—what they call a training impulse or load. [6]

This single input affects both fitness and fatigue, making it easier to correlate training load with performance. This is why many of the performance models are referred to as Impulse-Response Models. [3,5]

Researchers initially looked to heart rate to quantify training load. Again, it was Banister who stepped in to create a measure called TRIMP, which stands for TRaining IMPulse. [3] For those who use Strava, the brand’s ”Suffer Score” is just that—a heart rate-based training impulse score. TRIMP became the standard for decades, backed by scientific research.

That’s when Coggan and Allen, working with TrainingPeaks, took the existing Systems Models and reworked the formulas using power.

“Dr. Andy Coggan took that concept of TRIMP and really expanded upon it and applied them to the world of cycling,” Friel says. The pair developed their own power-based measure of training load called Training Stress Score, or TSS.

Researchers had focused on heart rate because it was physiological—it indicates the strain a workout places on an athlete. External measures such as power and speed do not. [1,3] As Friel explains, if an amateur and a pro both do a four-hour ride at 250 watts, the external load is identical, but the physiological strain and resulting fatigue is going to be very different.

The issue with heart rate is that it doesn’t measure efforts above VO2max well (things like sprints and Tabata-style intervals). Other factors such as heat, dehydration, and mental stress impact heart rate. In other words, it isn’t as accurate as power in certain circumstances—not to mention that training is increasingly prescribed based on power.

So, the group at TrainingPeaks created their TSS formula based on threshold power. (Riding one hour at threshold generates 100 TSS.) By basing TSS on threshold power, which Coggan considered a physiological benchmark, power then became more physiological. For example, if the amateur mentioned above has a threshold of 250 watts and the pro has a threshold of 400 watts, they will have very different TSS scores for that 250-watt ride.

In 2014, a series of studies led by Dr. Aaron Coutts in Australia compared the various methods of quantifying training load. Surprisingly, the external measures such as work and TSS correlated better than heart rate and TRIMP with actual performance and training load. [4]

Still, no matter how sophisticated the formulas get, they will never account for everything. Numbers don’t address the external factors of life, for example.

Understanding your performance graph

Most of the major training software has some version of the Performance Management Chart that is the culmination of decades of Systems Model research. Many coaches find them both surprisingly accurate and invaluable training tools, but it’s important you know how to read them. Here ares some tips.

Look for trends over time

“I’ve always felt there is immensely more power to the numbers when you look at them over a long stretch of time,” Friel says. “That paints an absolute picture, which is unique to each individual athlete.” The power of these charts comes from a historic evaluation, which means they require a good deal of data. TrainingPeak’s PMC, for example, requires at least 42 days of data for any sort of accuracy.

Ensure your threshold is accurate and updated

Your training load is the starting point that makes all of these calculations possible. That load is based on your threshold heart rate or power. Threshold and energy systems (zones) are the core of these advanced metrics, according to Friel. While using the highest time trial power you’ve ever seen will make you feel good, it will also result in bad metrics.

For an accurate number, lab testing is best. And for the rest of us, the simplest, although often the least accurate, is a 20-minute time trial after which you multiply the average power by 95 percent. There are better on-the-road tests, including the one created by INCSYD.

Know the three lines

Almost all performance graphs have some variation on three lines that represent fitness, fatigue, and form. It is the relationship between these lines that paints a picture of the individual athlete. Remember that the time course of each is different. Fitness is slow to build and dissipate while fatigue builds and disappears rapidly.

Golden Cheetah's version of the PMC
Golden Cheetah’s version of the PMC.
Xert's version of the PMC
Xert’s version of the PMC
TrainingPeaks TSS over a 12 month period

Know the fitness line (CTL)

Fitness is often referred to as Chronic Training Load. Since all the metrics are based on individual metrics, having the same CTL score as Peter Sagan doesn’t necessarily mean you’ll beat him. But to be a top competitor, you need to be in a certain range, and those ranges overlap amongst the categories, according to Friel. Top competitors can have CTL scores over 150 while beginning racers may be closer to 40 or 50.

Know your fatigue level (ATL)

Because fatigue is quick to appear and dissipate, the fatigue line is often also called Acute Training Load. A high fatigue score isn’t always a bad thing. “In order to improve,” Friel says, “you have to stress the system, then recover and let the fitness shine through.”

High fatigue at the right time is necessary. In the research, measures of fatigue had the lowest correlations. This may be partially due to the number of external “life” factors that contribute, and because fatigue builds on itself. So, you may want to think of this graph as the size of your recent impulse. Where you hope the CTL line is an upward trend, you want both highs and lows in ATL.

Know your form (TSB): fitness minus fatigue

Training Stress Balance (TSB) goes right back to the original Banister equation. It is the difference between your fitness and fatigue. A negative TSB may indicate that your current training load exceeds what you can easily handle. That’s a good thing during a good training block. Stay too low and you may risk overreaching. A positive TSB means you are training less than normal. That’s necessary for a peak, but keeping it too positive for too long means you’re detraining.

Find your performance in the relationship

No one line will tell you how you’re going to perform, nor is there a magic number to hit. Your fitness can be high, but if the fatigue is higher than your fitness and your form is bad, a rider with a lower fitness level can beat you. During heavy training blocks, pushing more fatigue (ATL) at the cost of form (TSB) to raise your fitness (CTL) is necessary. But to race at your best, a balance of fitness and positive form is necessary even if your CTL must drop a little.

Find your optimal balance

Friel points out that every rider has a different optimal balance of CTL and form. He has seen Tour de France riders perform well in the last week of the race with a negative 80 form, while a rookie Tour rider might crack under those conditions. Likewise, a rider may perform at a really high CTL in April, but the optimal CTL level is often lower later in the season because fatigue builds up over the year.

Take ownership of your fatigue

A day off the bike will lower your ATL, but if you spend it getting little rest and running around town, the graph will fool you—or, better said, you will fool the graph. Own your recovery. “A rest day is often more important than the hard days,” Friel says. “If you don’t have those, then you can’t have that fitness shine through to create form.”

It’s a tool—be holistic

“I still love the numbers,” Friel says. “But I’m definitely not all about the numbers anymore. I listen to myself and use the numbers in combination with my sensations.” It’s crucial to pay attention to how you feel every ride. More importantly, your first goal should always be to achieve the goal of the ride or training block—not a number.

References

  1. Halson SL. Monitoring Training Load to Understand Fatigue in Athletes. Sports Med 2014;44:139–47. https://doi.org/10.1007/s40279-014-0253-z.
  2. Banister EW, Calvert TW. Planning for future performance: implications for long term training. Can J Appl Sport Sci J Can Des Sci Appliquées Au Sport 1980;5:170–6.
  3. Jobson SA, Passfield L, Atkinson G, Barton G, Scarf P. The Analysis and Utilization of Cycling Training Data. Sports Med 2009;39:833–44. https://doi.org/10.2165/11317840-000000000-00000.
  4. Wallace LK, Slattery KM, Coutts AJ. A comparison of methods for quantifying training load: relationships between modelled and actual training responses. Eur J Appl Physiol 2014;114:11–20. https://doi.org/10.1007/s00421-013-2745-1.
  5. Taha T, Thomas SG. Systems Modelling of the Relationship Between Training and Performance. Sports Med 2003;33:1061–73. https://doi.org/10.2165/00007256-200333140-00003.
  6. Wallace LK, Slattery KM, Impellizzeri FM, Coutts AJ. Establishing the Criterion Validity and Reliability of Common Methods for Quantifying Training Load. J Strength Cond Res 2014;28:2330–7. https://doi.org/10.1519/jsc.0000000000000416.