An Introduction to Training Metrics, Part 1

Physiologists and coaches have attempted to quantify training through both external and internal measures. We review the primary training metrics and detail the benefits and shortcomings of each.
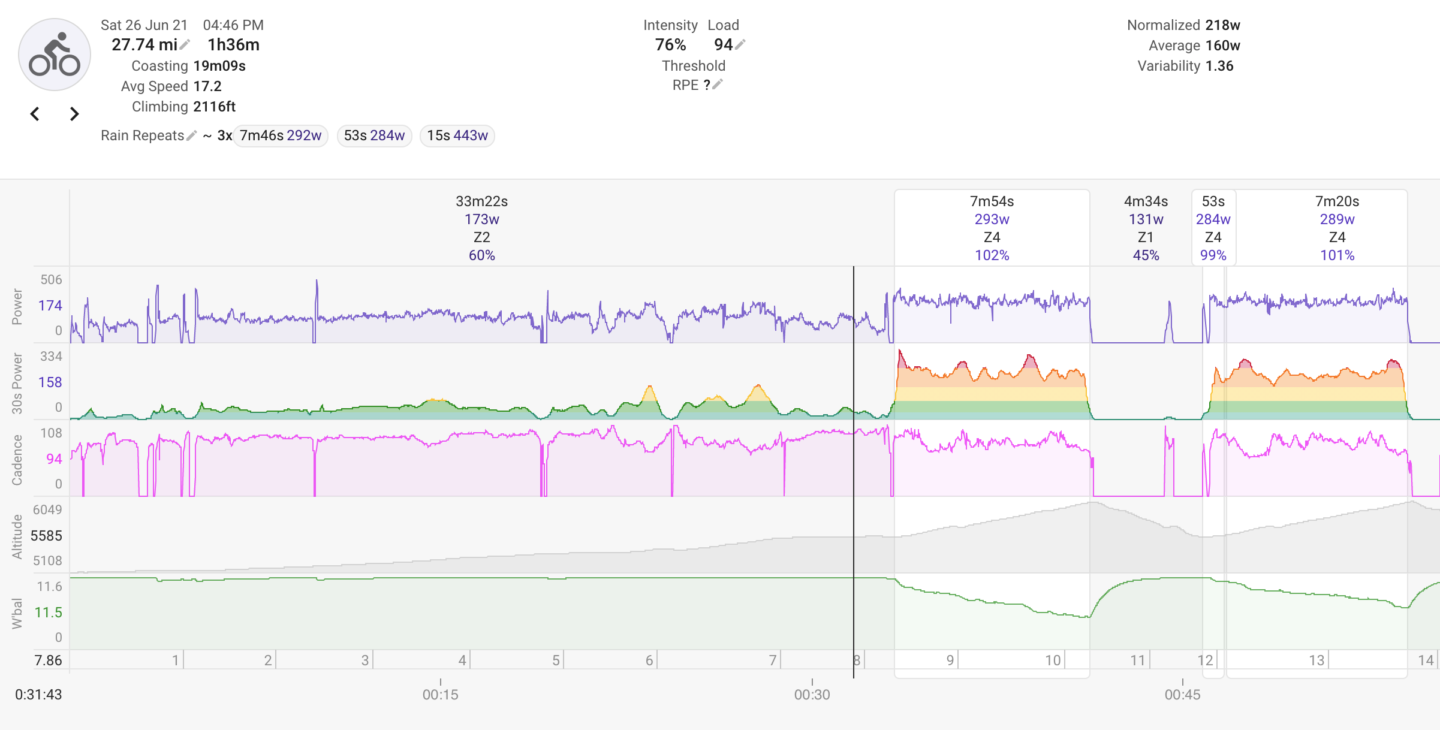
training metrics from intervals.icu

Nowadays, many athletes joke that if their activity isn’t recorded, analyzed, and segmented on Strava or some other analysis tool, they question if it really happened. Joking aside, an obsession for numbers and data is taking over how many people train.

Welcome to the digital age of information.

Some riders question if this increasing over-reliance on numbers is a good thing. Retired pro Phil Gaimon goes so far as to say, “I’m a believer that all that stuff is bull s*** and you should learn your body. To be a slave to numbers without acknowledging your personal sensations, I think that’s where you can make errors.”

Dirk Friel, cofounder of TrainingPeaks, agrees that training, and coaching, is not as simple as hitting certain numerical benchmarks throughout the season.

“Coaching by numbers is not painting by numbers, and I don’t think we should all coach by numbers,” Friel says. That said, the former professional racer feels equally strongly that the numbers make training three dimensional and add clarity. As he puts it, it’s like getting your first pair of glasses.

If you’re training for a charity ride, you likely don’t need that level of “clarity.” However, at higher levels of sport, where every second counts, it leads to a simple question: Why would you ignore the numbers?

The fact is, the numbers can be highly useful, even if they are occasionally addictive. Let’s make sense of the increasing number of metrics available on your bike computer and training software.

The science of numbers

A 2014 study published in Sports Medicine, which looked at the efficacy of primary training metrics, found there was little scientific evidence to support any of them over others. [1] It was as much about personal preference.

The review divided the various metrics into external and internal measures. Scientifically, external measures indicate the work being completed by the athlete, with no consideration of their internal characteristics. The data simply express what’s going into the bike, but not how much of a toll it’s taking on the athlete.

Conversely, internal measures indicate an individual’s physiological stress. These measures indicate how hard the work is on the body. But they say nothing about what’s going on with the bike—whether the athlete is going slow or fast.

If we use a car’s dashboard as an analogy, the speedometer is akin to the external measure that indicates how fast the car is going—but it says nothing about whether the engine is a 12-cylinder Ferrari engine or a 4-cylinder Fiat. However, RPM and engine temperature indicate how hard the engine is working to produce that speed, much like an internal metric does for an athlete.

Heart rate, rate of perceived exertion, and sleep quality are examples of internal measures. Traditionally, physiologists have favored internal measures for training since they show physiological strain.

However, internal measures are affected by a variety of factors outside of training. Many consider that a shortcoming. Friel points out that sleep quality, stress, caffeine, temperature, and altitude can all influence heart rate. Furthermore, heart rate is slow to respond to an increase in effort and, since it plateaus at VO2max, it doesn’t indicate the true strain of maximal efforts such as sprints.

External measures, such as power, speed, and daily steps, are becoming increasingly more popular as technology makes them readily accessible. These metrics can be captured quickly and consistently: 30kph is always 30kph, and 300 watts is always 300 watts (assuming your power meter is calibrated correctly).

More importantly, they can be compared across athletes. The rider with the best power-to-weight ratio is generally first up a climb, and the winner of a race always has the fastest average speed. Conversely, one rider may be at 150 beats per minute (BPM) and another at 140 BPM, but that internal metric tells you nothing about how those riders are performing against one another.

The issue with external measures is that they say nothing about the individual. This is why Gaimon doesn’t let the athletes he coaches get a power meter right away. “I like to say, ‘You need to learn what five minutes all-out feels like without staring at a screen.’”

Translating external load to internal strain

Pioneers in the training data field, including Friel, Dr. Andy Coggan, and Hunter Allen, tried to find a way to use external measures—power in particular—to illustrate what’s going on internally. Eventually they found a Rosetta Stone that allowed measures of external load to be translated into internal strain. That Rosetta Stone was a rider’s threshold power, and for runners threshold pace.

“That’s at the core,” Friel says. “All these advanced metrics are really based on that threshold power.”

A 2014 study in the Journal of Strength and Conditioning Research found that using threshold power to translate external measures into internal strain correlated as well as heart rate did to the gold standard measure of internal strain—VO2 consumption. Still, the study suggested that heart rate was still the best indicator below VO2max. [2]

Ironically, correlating external measures to physiology leaves most power-based metrics subject to many of the same issues as internal measures. Threshold power, Friel says, “can change day-to-day simply based on your sleep quality and stress level.”

Know your metrics

Our head units provide an increasingly large number of metrics that may leave you confused or intimidated. Let’s define a few, using either internal or external measures to gain insight into physiology.

Heart rate and power

There are many sophisticated metrics, but most are just calculations based on a few raw recorded datasets. Heart rate and power are the two most common and useful internal and external datasets. There is a great deal of debate over which is more important; it usually comes down to whether you place greater value on internal or external measures.

Another important external dataset is cadence. And while it is not measured, another key internal metric is rate of perceived exertion (RPE). It’s that “metric” that Gaimon wants his athletes to learn first.

Functional threshold power (FTP)

Defined as the highest power an athlete can sustain for an hour, FTP has become the traditional Rosetta Stone by which most external translations are ultimately based. Keep in mind that it doesn’t always correlate well with true physiological threshold power or maximal lactate steady state (MLSS) determined in a lab. Friel says FTP was chosen because it was easy to test for most people.

It is important to keep this number updated and accurate; if you don’t, all your metrics can fall apart. And don’t let ego get the better of you—the highest one-hour or 20-minute power you’ve ever seen is not a good number to use as your current FTP. “Fortunately, now the software itself will fine tune it to the individual,” Friel says.

Training zones

One of the first attempts to organize and categorize an effort by heart rate and power data was through training zones. Assigning an effort to a particular bucket yields more information about its level than using average heart rate or power.

The best training zones are delineated by the points at which there’s a change in energy system or physiological response, further helping to make power an internal estimate. While older zone models were frequently based on percentages of max heart rate, most zones now use percentages of threshold or FTP.

It may sound simple, but being aware of whatever zone you’re targeting is very important, since different zones produce different adaptations.

Normalized power

Many of us like to look at our normalized power (NP) for a ride because it’s always higher than our average power. Let’s look at how this number is derived. It was, in fact, one of several formulas created by Coggan, Allen, and Friel to correlate power with internal physiological response.

If you look at a raw power graph compared to a heart rate graph, they look very different. Power is much more variable. That prevents it from correlating well with true physiological strain. Since oxygen consumption and heart rate tend to respond on a 30-second constant, normalized power uses a moving 30-second average. It then weights the averages based on a regression derived from blood lactate response. The result is a number that should better represent internal strain.

NP is calculated using a complex algorithm, which takes into account the variance between a steady workout and a variable effort. The resulting number is an attempt to better quantify the physiological cost of a ride with a higher perceived effort given its variable nature. Just remember that normalized power shows how hard the ride was on your body—it does not indicate how hard you were riding.

Training stress

Friel’s TrainingPeaks software uses a training stress score or TSS, and now most software has an equivalent. Training stress is an attempt to measure the total internal physiological strain of a ride.

TSS is calculated by weighting the time you spend in each zone. An hour at FTP generates a score of 100, while an hour in a lower zone may only generate a score of 50. Friel notes that a short intense ride and an easy five-hour ride can produce the same training stress score, but the effects on the body are entirely different. TSS says nothing about how the number was generated.

Power Duration Curve

The problem with using threshold power as the link between external load and internal strain is that it’s only one attribute. Friel points out that two riders—for example, a sprinter and a GC rider—can have the same FTP, but they are very different riders.

To offer a more complete profile of a rider’s strengths and weaknesses, Dr. Coggan developed the Power Duration Curve (PDC). Instead of just looking at 60-minute power, the curve traces peak powers from less than a second to over five hours. The shape of the curve tells a lot about the type of rider and his or her strengths.

Sprinters tend to have very high wattages under 20 seconds, while time trialists will have flatter curves. Below is an example of a PDC for a time-trial-style rider:

Figure 1. A sample Power Duration Curve. The red line indicates the smoothed power duration curve, defining this rider’s peak power numbers for different durations. The green line indicates the aerobic contribution to FTP, and the blue line indicates the anaerobic contribution. The dashed blue line indicates the 90-day modeled FTP.

Beyond threshold: max power, anaerobic capacity, W’, and stamina/toughness

Armando Mastracci, developer of Xert, says there are four key physiological aspects of a rider that shape the power duration curve. The first is max power, or the highest power you can hit. The second is anaerobic capacity, or how sharply the curve declines from max power to threshold power. The third is threshold power.

If you drew a horizontal line through the curve at your threshold power (indicated by the dashed blue line above), and then filled in the space between that line and the graph, you’d get what TrainingPeaks calls functional reserve capacity. It’s also called W’ (watt prime.) It’s basically a measure of how much energy you have above threshold.

The fourth metric is harder to define, but it’s the focus of many pros. Called stamina or toughness, it’s a rider’s ability to ward off fatigue.

TrainingPeaks and Xert, both of which track these four attributes, will allow you to see your relative strengths and weaknesses and where you should focus your training. For example, Friel points out that criterium riders may want to sacrifice some FTP for functional reserve capacity.

Decoupling: the separation of internal and external

Perhaps the most powerful metric is found in the relationship between internal and external measures. Theoretically, at a given heart rate, we should produce a given wattage. Over time, as we get fitter, that power should go up. Efficiency, one of the most important adaptations, is defined as the relationship between internal strain and external load. On the flip side, a short-term change in the relationship, or decoupling, can have negative meaning. This is also referred to as cardiovascular drift.

A rise in heart rate relative to power over the course of a ride indicates fatigue or dehydration. You may need to work on your endurance. Friel tracks that decoupling on long rides to determine when his athletes should switch from base training to their build period. On the other side, a sharp decline in heart rate relative to power over a few days or a week is an early symptom of over-training.

Rate of perceived exertion

The oldest, and definitely the least sexy, metric is RPE, or how hard an effort feels. Friel and Gaimon (not to mention many other coaches and pros) all preach the same message: It’s really important to be in touch with yourself as an athlete; if you are too focused on the numbers, then you can forget that perhaps you just feel bad one day.

On one ride, 250 watts may feel easy. On another ride, you might struggle to break 130 BPM, and 250 watts feels like a time trial. No metric accounts for a bad night of sleep or travel, high work stress, or tired legs. You still need to look at the whole picture and know when to push and when to pull the plug.

In other words, the number one metric, according to Friel, is whether you are accomplishing the original intent of the ride—with or without the numbers.

References

  1. Halson SL. Monitoring Training Load to Understand Fatigue in Athletes. Sports Med 2014;44:139–47. https://doi.org/10.1007/s40279-014-0253-z.
  2. Wallace LK, Slattery KM, Impellizzeri FM, Coutts AJ. Establishing the Criterion Validity and Reliability of Common Methods for Quantifying Training Load. J Strength Cond Res 2014;28:2330–7. https://doi.org/10.1519/jsc.0000000000000416.