
A common expression among top pros is “it’s not how hard you can go for five minutes, but how hard you can go for five minutes after four hours.” Granted, only pros would set the mark at four hours—for the rest of us, it’s how hard we can go after two hours.
If you take two athletes, Athlete A and Athlete B, and put them on a start line fresh, Athlete A may be able to beat Athlete B in a five-minute race. But let’s say Athlete B is “tougher” and puts out the same five-minute effort after two hours of hard racing while Athlete A can only manage 80%. Because those big race-winning efforts happen at the end of the race, Athlete B is going to win a lot more races, despite the fact that Athlete A has more raw power.
This is the essence of durability. Racing isn’t just a test of how strong you are, but how well you can sustain your strength. Durability is critical to racing, and fortunately, it is highly trainable. The true challenge, as Dr. Stephen Seiler and others studying durability have discovered, is knowing how to train it effectively and how to measure your progress.
How to measure durability
Seiler defines durability as the “duration a given sub-threshold pace/power can be maintained without significant increase in physiological cost.” Alright, that’s a mouthful, but let’s break it down. First, the focus is on sub-threshold intensities—what you can do for hours, not minutes. That’s also why duration is important. But, what we’re really trying to measure is the increase in physiological cost. So, what does that mean?
To answer that question, we have to first understand an important concept in exercise physiology called a “physiological steady-state.” Simply put, a steady state is a pace or effort that you can sustain. An all-out sprint is not sustainable, but if you went out for an easy walk, you’d consider that pace very easy to maintain for a long time. Doing that walk would put you in a physiological steady-state. Or put another way, there isn’t a rapidly increasing cost for the effort.
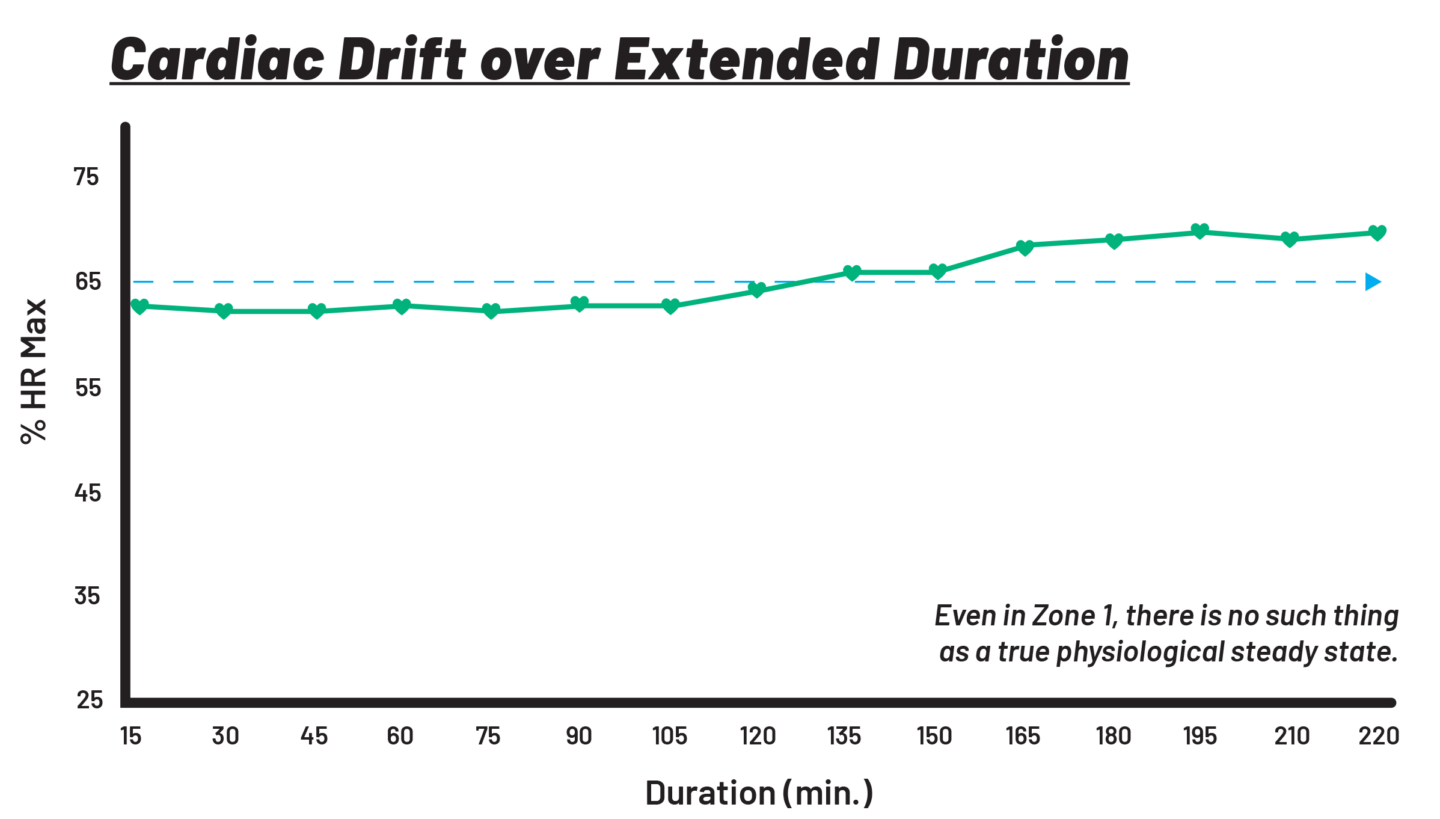
Now let’s take this example to an extreme and imagine that you decide to try to sustain that easy walking pace for five days without rest. Eventually even that pace would become an enormous strain. This is why many researchers, including Seiler, have said that there is no such a thing as a true physiological steady state. Go long enough and any steady-state will “break.” It’s just a matter of how long before that happens. At an easy intensity, it’ll take hours. At your lactate threshold, you might last 45 minutes to an hour, and at a VO2max pace, you’ll only have minutes.
Measuring durability means measuring both how long you can go before that physiological steady-state breaks and the degree to which it breaks. Let’s explore a few ways you can measure durability.
Method 1: Look for the point where external and internal metrics decouple
In this video, Seiler explains the difference between internal and external metrics. External metrics are things like power or pace. They are constant, meaning 300 watts is always 300 watts and a seven-minute mile pace is always a seven-minute mile pace regardless of the athlete’s level or how tired they are. These metrics are “external” to the athlete’s physiological response. [1,2]
Internal metrics are things like heart rate and rate of perceived exertion (RPE). Internal metrics are a measure of the stress an athlete’s body is experiencing while putting out that given power or pace. So, both an amateur and a professional can run at a six-minute mile pace (external metric), but the amateur will be struggling at their maximum heart rate while the professional will be gliding along at a manageable 140 bpm (internal metric.) [1–3]
An athlete is in a physiological steady-state when both their external and internal metrics are holding steady, meaning, if a cyclist rides at a constant 200 watts, their heart rate should remain constant. Once heart rate starts increasing relative to their power, the two metrics have decoupled and the athlete is no longer in a steady-state:
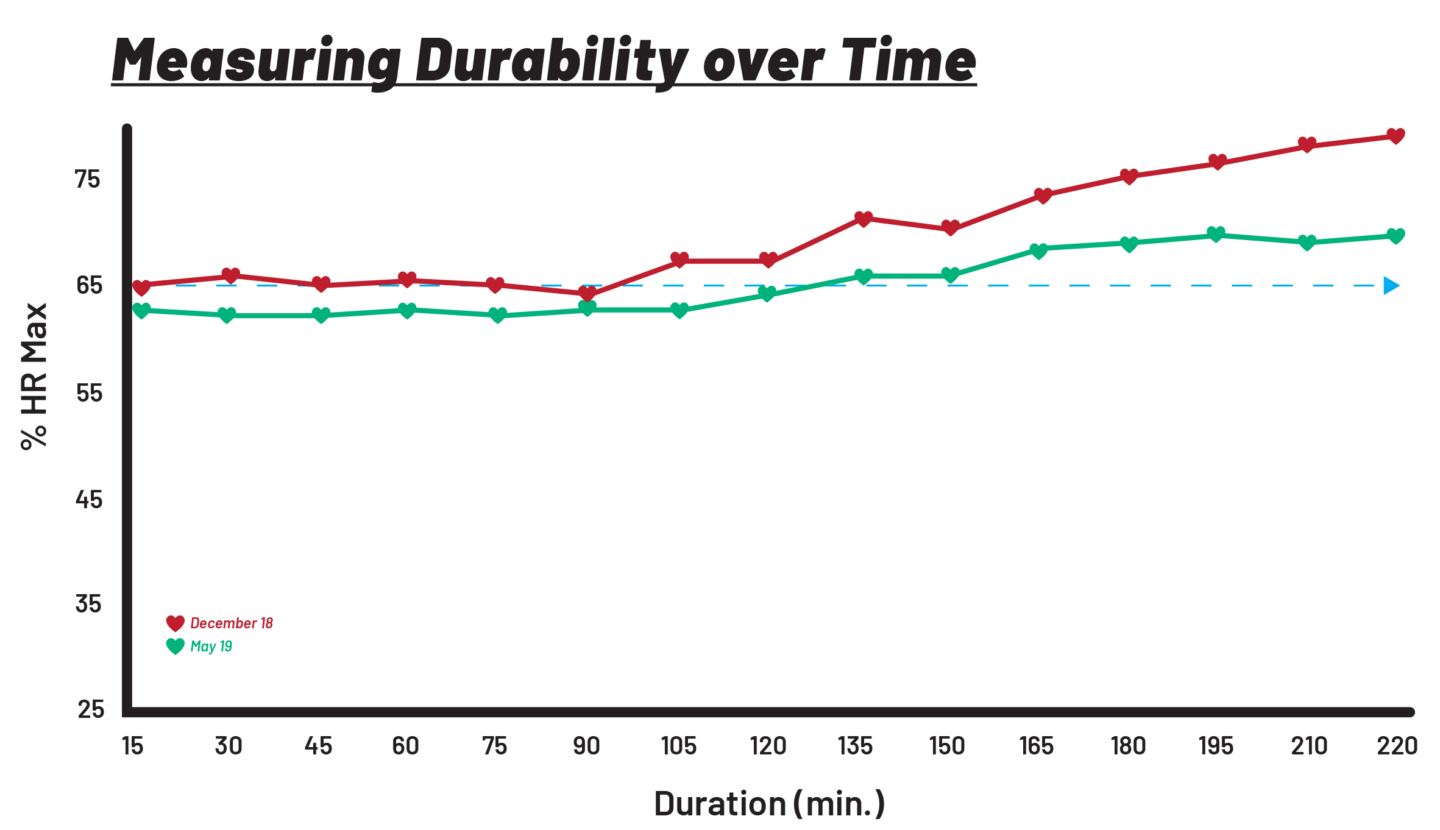
That rise in heart rate relative to power or pace is called cardiac drift or decoupling since the heart rate graph basically “decouples” from the power graph. Regardless of what you call it, it’s one of the best ways to measure durability. [4,5] When it takes longer for the athlete to start experiencing cardiac drift or if the cardiac drift is less pronounced, durability has improved. That’s seen in the graph below which comes from Seiler’s own training data. During both workouts, he held a steady wattage for almost four hours. The red line from 2018 shows greater cardiac drift than the green line from 2019, demonstrating improved durability.
The problem is, most of us don’t want to spend hours sitting on a treadmill or trainer at a set wattage or pace to measure our durability. It would be much easier if we could see cardiac drift in a regular workout.
To solve this problem, Seiler found a way of graphing cardiac drift in any workout even if the pace or power is not steady. The calculations are complex and beyond the scope of this article, but in short, he generates a graph that takes heart rate as a percent of heart rate reserve (explained here) and divides it by power as a percentage of the athlete’s peak six-minute power. In a steady state, those two percentages should be the same and divide to one. If that calculation is graphed over the course of a ride or run, cardiac drift occurs when the green line starts going above one (marked by the dotted line in the WKO figure below).
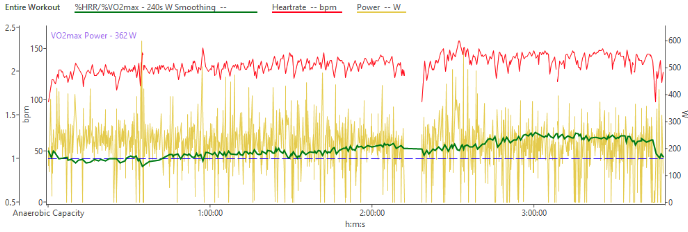
What’s unique about this graph is that as long as the athlete’s maximum heart rate, resting heart rate, and six-minute peak power are accurate, their graph will always be at one when they are experiencing no cardiac drift. That is of course assuming they aren’t highly fatigued or dehydrated.
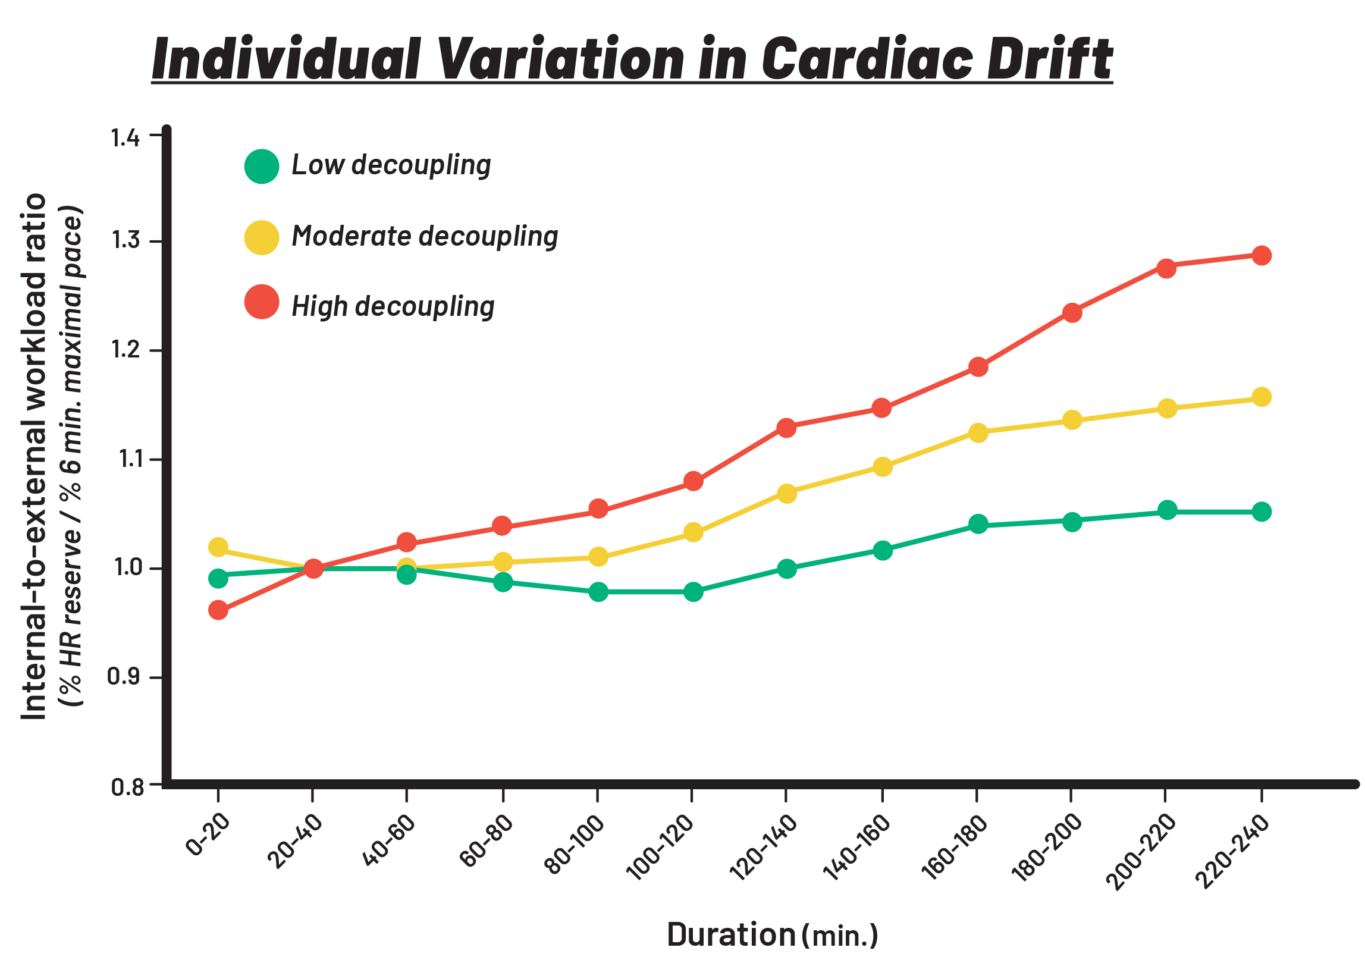
Using this method of calculating cardiac drift, Seiler and his team were able to show how much durability could vary in even experienced endurance athletes. [6]
Method 2: Track the drop in peak power
There is another way for cyclists to measure durability that uses their power-duration curve. This curve can be found in most training software. It graphs a cyclist’s best power outputs from one second out to their longest ride. Here’s an example of a fairly typical power-duration curve.
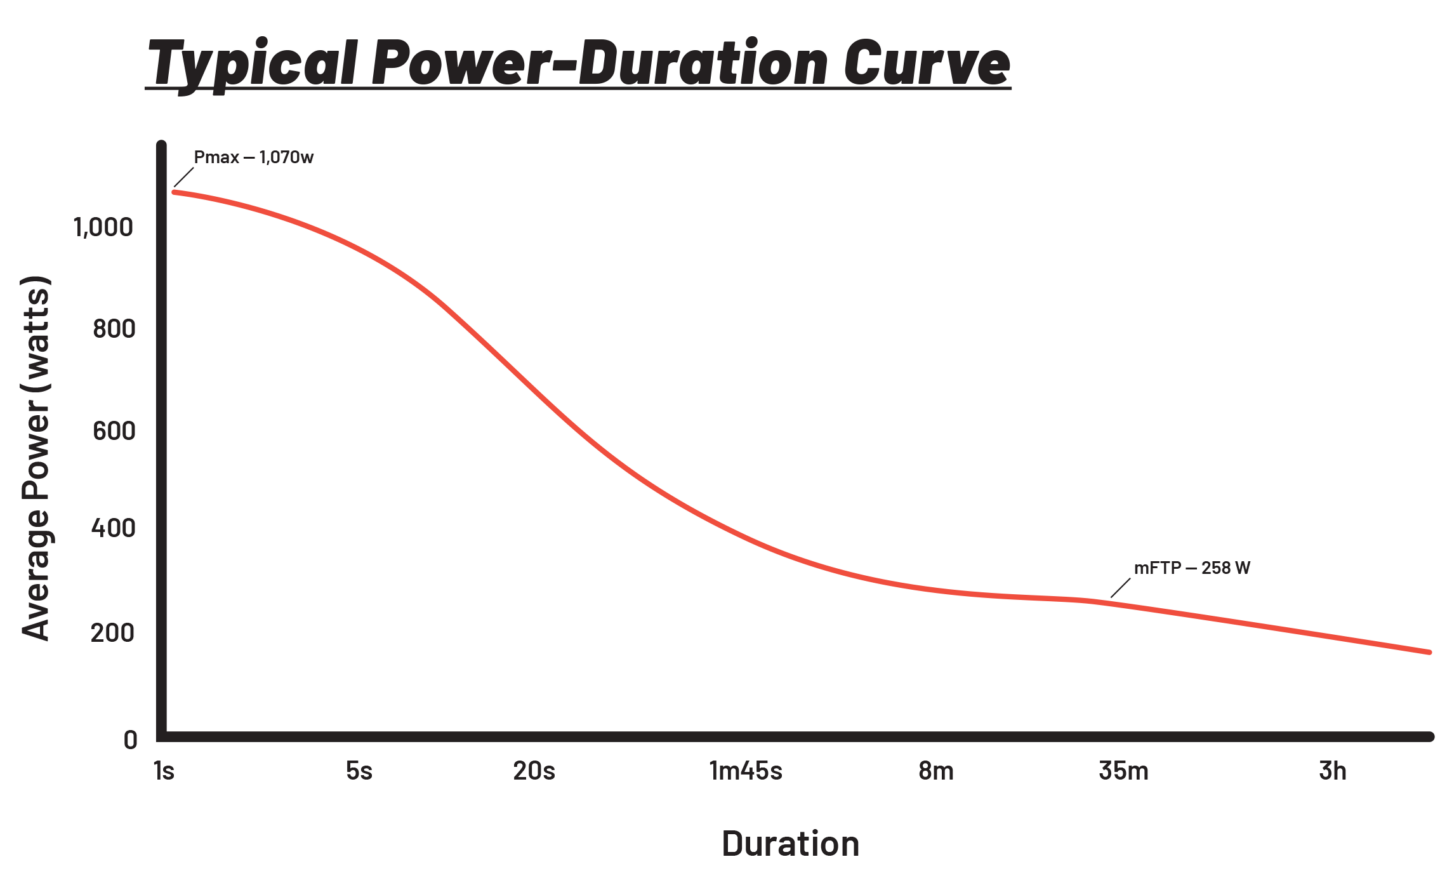
Returning to the idea that “it’s not how hard you can go for five minutes, but how hard you can go for five minutes after two hours,” an athlete with great durability is still able to put out the same peak wattages after two hours. So, their power-duration curve doesn’t change. An athlete with poor durability, on the other hand, will see their power-duration curve drop.
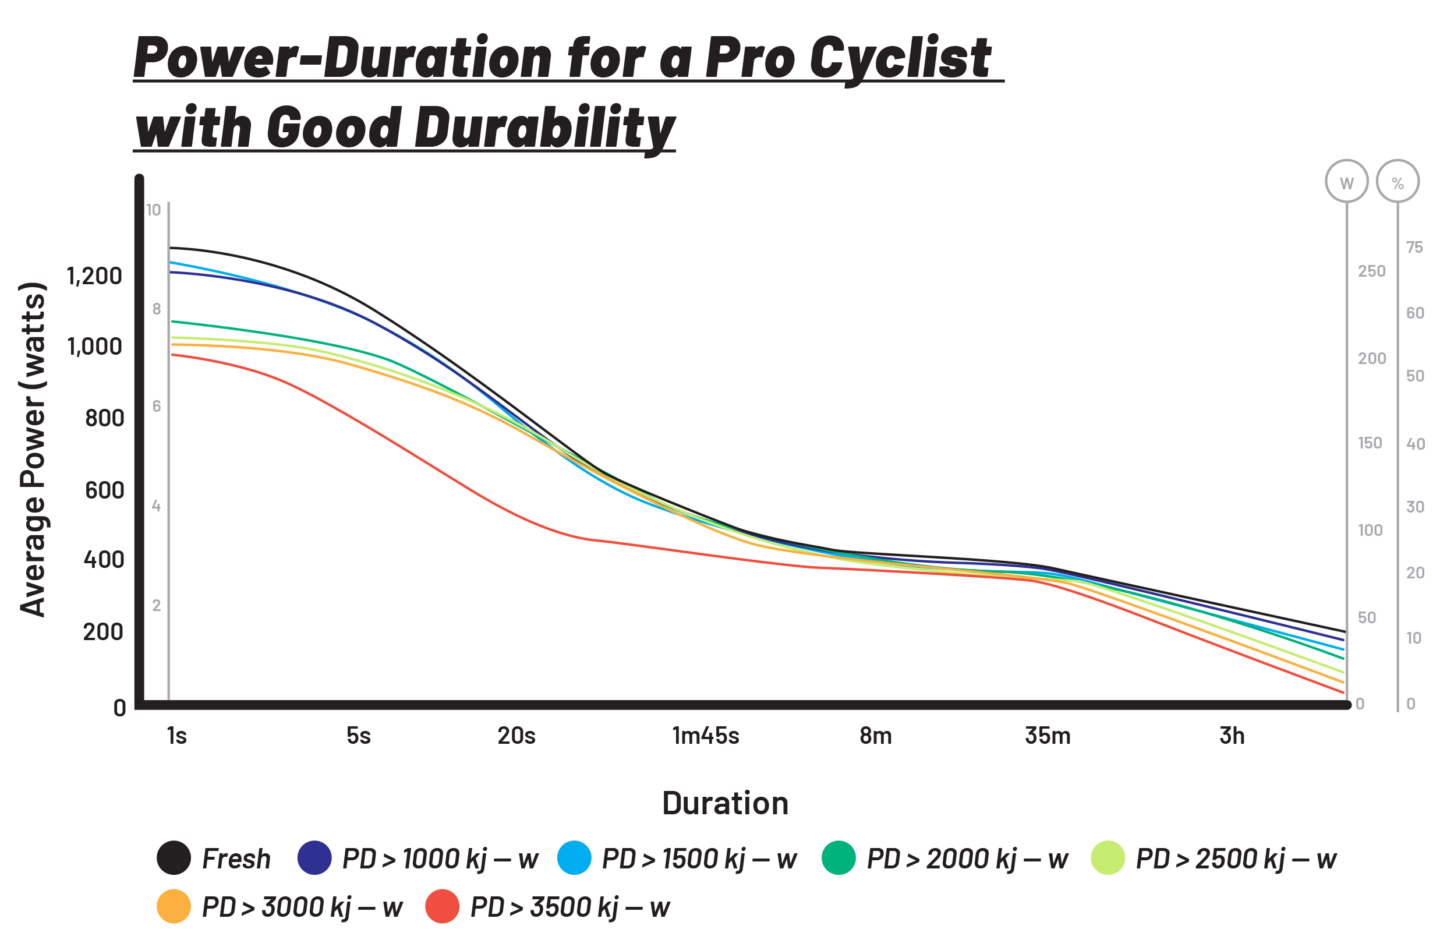
Dean Golich, Kevin Williamson, and Tim Cusick created a chart in WKO5 that shows this change in the power-duration curves. It generates multiple power duration curves, each representing the athlete’s best wattages after they’ve burned a certain number of calories (specifically, kilojoules). For example, in the graph below, from a professional cyclist with good durability, the black line is their power duration curve fresh, while the light blue line is their curve after burning 1,500 kj (approximately 2 hours of riding).
In comparison, here is the same chart from an amateur athlete with poor durability.
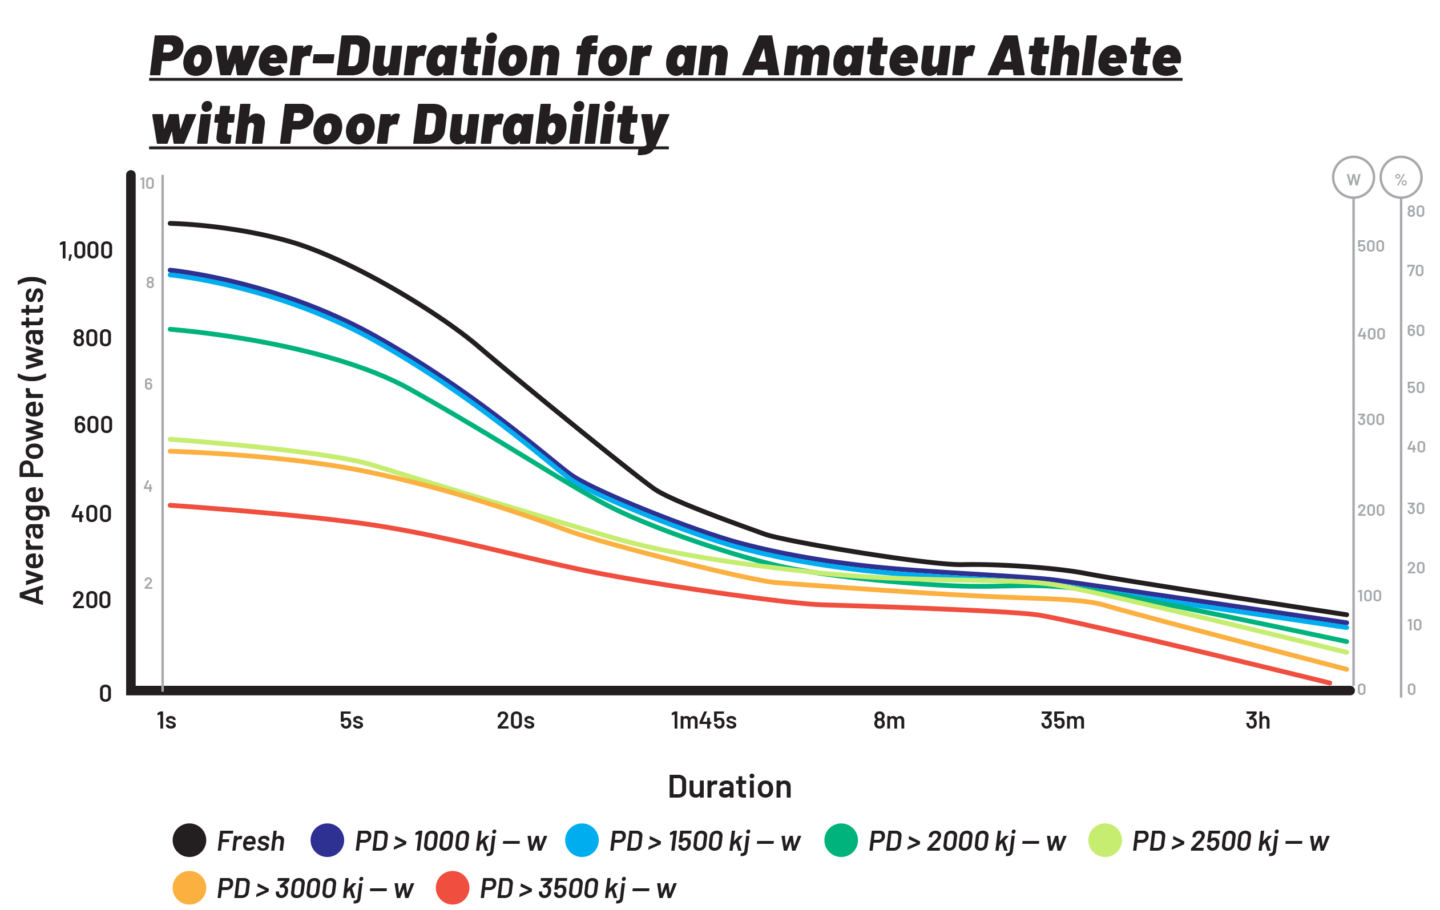
Notice that when they are fresh, the professional and amateur cyclists have a peak 20-second power that is not so disparate (about 800 watts on the black line). But after about three hours of riding (the yellow line), the difference between these two athletes really shows up. There’s no question who would win the sprint—it wouldn’t even be a contest.
Why we lose our steady state
There are many terms for the point where heart rate starts rising despite a steady power or pace— cardiac drift, decoupling, or loss of a physiological steady state. Regardless of what you call it, once it occurs, maintaining the same pace places a greater strain on the body. And in a race, it means you are losing strength.
There are a myriad of factors that contribute to the loss of a steady state. It is important to understand that some of those factors are environmental and don’t indicate fitness, while others are physiological and do indicate fitness. This makes measuring durability complicated.
Environmental factors include heat, humidity, and dehydration. [7,8] All of these factors will raise heart rate as the heart struggles to keep the body cool and deliver sufficient blood to working muscles. Environmental factors can produce significant cardiac drift at an intensity and duration that would produce no cardiac drift under normal environmental conditions.
There are many physiological contributors to cardiac drift, including glycogen depletion and muscle fiber fatigue. Let’s take a closer look at muscle fiber fatigue.
When you’re training easy at a Zone 1 pace (on a three-zone model) you’re using almost entirely slow-twitch muscle fibers. It’s commonly thought that slow-twitch fibers never fatigue, but that’s not quite true. They will experience minor damage—the mitochondria will become less efficient, and eventually their ability to generate power will be reduced. [9,10] As a result, more fibers are needed to do the same work. Recruiting more fibers will create more demand for oxygen, which leads to an increase in heart rate and ultimately cardiac drift. [9]
What happens when slow-twitch fibers fatigue?
But what might be even more important here is that as the slow-twitch fibers fatigue, fast-twitch fibers will be recruited to do the work normally reserved for slow twitch fibers. This is both good and bad.
The good news: Recruiting fast-twitch fibers to do the work of slow-twitch fibers trains them to work more aerobically, which benefits endurance athletes. One of the only ways to get this training benefit is by allowing some cardiac drift and slow- twitch fiber fatigue to occur during long workouts. It is one of the reasons that long slow workouts are still so important.
The bad news: Pushing cardiac drift too much can contribute to oxidative damage and autonomic stress. Several studies have shown that even easy workouts below LT1, if they are long enough, can contribute to autonomic stress comparable to an interval session. [10–12]
Autonomic stress delays recovery and can lead to overtraining if pushed too frequently for too long. One of the great advantages of polarized training is that it maximizes adaptations while keeping the risk of overtraining low by avoiding autonomic stress. So, pushing cardiac drift too much on even on easy, long workouts can hinder these advantages.
So, how can you balance the good and bad— get the benefits of cardiac drift without the negative impact of autonomic stress—to optimize your training?
How to train durability
To train durability, you need to do sub-threshold work long enough to force the body out of its physiological steady state. In other words, you will experience some cardiac drift. But how much is too much?
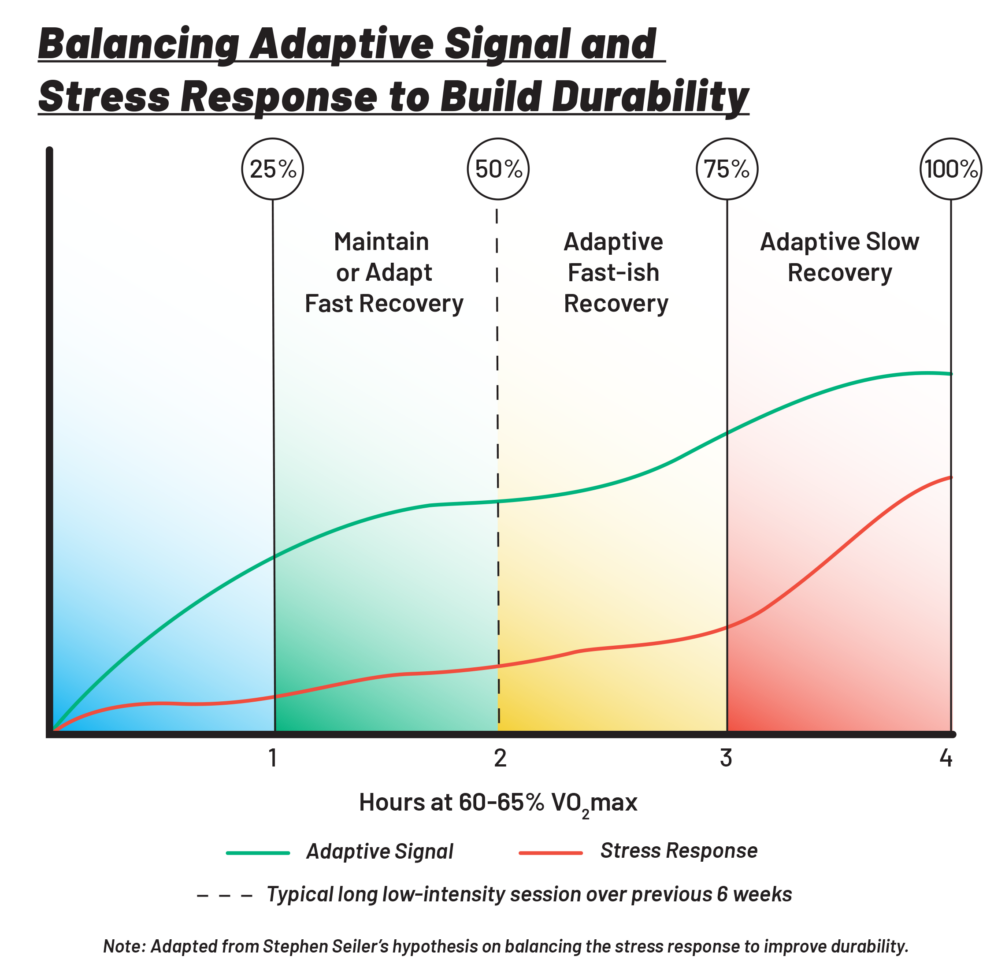
This important relationship between adaptation and stress is represented in the graphic below, adapted from one of Seiler’s hand-drawn sketches. The green line shows the adaptative signal we can experience from a workout while the red line represents the autonomic stress likely to accompany that effort. The ideal workout maximizes the adaptive signal but stops short of the point where autonomic stress really starts to kick up.
To be clear, the research hasn’t been done to identify a physiological point, but as a coach, I encourage my athletes to ride about 45 to 60 minutes after they start experiencing cardiac drift. Similarly on a run, they can consider doing an extra 20 to 30 minutes. My belief is that this allows them to get the benefits of fast-twitch fiber recruitment while avoiding too much stress. That of course assumes that environmental factors such as heat, humidity, and hydration aren’t major contributors to their cardiac drift.
Surprisingly, another way to improve durability, which has been demonstrated in research, is to incorporate strength training into your routine. Strength training will improve both the power of slow-twitch fibers and improve their resistance to damage. In other words, the athlete will be able to go longer before they fatigue, postponing the recruitment of fast-twitch fibers, and get out of a physiological steady state.
Advanced durability training: “Cheating” the polarized model
So, in a long, slow workout when an athlete starts experiencing cardiac drift, should they lock in at a set power or pace and let their heart rate drift up, even if that means going above a prescribed heart rate zone, or hold a steady heart rate and let power or pace decline as needed?
The answer is complicated and it may mean you need to periodically “cheat” the polarized training model to maximize your adaptive gains.
Most of the year I have my athletes do long, slow workouts by heart rate and let their power or pace decline to remain in the right range. Particularly in the base season when race specificity is less important, I want athletes to be careful about too much autonomic stress.
However, once the athlete is approaching race season, there is a value to flipping the prescription. At this point of the season, I have athletes train by power or pace and let the heart rate drift for several weeks. Training this way is more race specific and athletes need to learn to tolerate that strain later in an event.
When you let heart rate drift up in order to maintain your power or /pace, this entails significantly more fast-twitch fiber recruitment later in the ride, forcing aerobic adaptation in those fibers. [13] This is important because the research is showing that the biggest short term adaptation we see when peaking for an event is our IIb fibers increase their ability to work aerobically. [14] So, there is a solid argument to be made for forcing fast-twitch fibers to work aerobically as you prepare for a peak event despite the autonomic stress it generates.
With stronger, more experienced athletes, I push this cheat a little further by adding efforts to the end of a steady Zone 1 workout (on a three- zone model). The athletes do the efforts around the point where they start seeing cardiac drift. Here are some examples of the efforts they might add:
- 30–45 minutes at Zone 2 or sweet spot
- Several 10-minute hill climb efforts at threshold (high Zone 2 or low Zone 3)
- 4–5 one- or two-minute climbs at all-out effort, maintaining pace after cresting the top of the hill
Keep in mind that doing efforts when you have already lost your steady state can contribute a lot of stress, which a polarized approach tries to limit. So, it’s important to use efforts like this sparingly. But if you can maintain that critical balance, these workouts are race-specific, they train fast-twitch fibers in ways that are hard to do with any other type of workout, and they are great for building durability. They are well worth the periodic cheat.
REFERENCES
[1] Wallace LK, Slattery KM, Coutts AJ. A comparison of methods for quantifying training load: relationships between modelled and actual training responses. Eur J Appl Physiol 2014;114:11–20. https://doi.org/10.1007/s00421-013-2745-1.
[2] Wallace LK, Slattery KM, Impellizzeri FM, Coutts AJ. Establishing the Criterion Validity and Reliability of Common Methods for Quantifying Training Load. J Strength Cond Res 2014;28:2330–7. https://doi.org/10.1519/jsc.0000000000000416.
[3] Halson SL. Monitoring Training Load to Understand Fatigue in Athletes. Sports Med 2014;44:139–47. https://doi.org/10.1007/s40279-014-0253-z.
[4] Coyle EF, González-Alonso J. Cardiovascular Drift During Prolonged Exercise: New Perspectives. Exercise Sport Sci R 2001;29:88–92. https://doi.org/10.1097/00003677-200104000-00009.
[5] Hamilton A. Banishing cardiovascular drift: a master stroke for endurance athletes? n.d.
[6] Maunder E, Seiler S, Mildenhall MJ, Kilding AE, Plews DJ. The Importance of ‘Durability’ in the Physiological Profiling of Endurance Athletes. Sports Med 2021:1–10. https://doi.org/10.1007/s40279-021-01459-0.
[7] Wingo JE, Ganio MS, Cureton KJ. Cardiovascular Drift During Heat Stress. Exercise Sport Sci R 2012;40:88–94. https://doi.org/10.1097/jes.0b013e31824c43af.
[8] Wingo JE, Stone T, Ng J. Cardiovascular Drift and Maximal Oxygen Uptake during Running and Cycling in the Heat. Med Sci Sport Exer 2020;52:1924–32. https://doi.org/10.1249/mss.0000000000002324.
[9] Kounalakis SN, Nassis GP, Koskolou MD, Geladas ND. The role of active muscle mass on exercise-induced cardiovascular drift. J Sports Sci Medicine 2008;7:395–401.
[10] Fernström M, Bakkman L, Tonkonogi M, Shabalina IG, Rozhdestvenskaya Z, Mattsson CM, et al. Reduced efficiency, but increased fat oxidation, in mitochondria from human skeletal muscle after 24-h ultraendurance exercise. J Appl Physiol 2007;102:1844–9. https://doi.org/10.1152/japplphysiol.01173.2006.
[11] Tremblay MS, Copeland JL, Helder WV. Influence of exercise duration on post-exercise steroid hormone responses in trained males. Eur J Appl Physiol 2005;94:505–13. https://doi.org/10.1007/s00421-005-1380-x.
[12] Seiler S, Haugen O, Kuffel E. Autonomic Recovery after Exercise in Trained Athletes. Medicine Sci Sports Exerc 2007;39:1366–73. https://doi.org/10.1249/mss.0b013e318060f17d.
[13] Dudley GA, Abraham WM, Terjung RL. Influence of exercise intensity and duration on biochemical adaptations in skeletal muscle. J Appl Physiol 1982;53:844–50. https://doi.org/10.1152/jappl.1982.53.4.844.
[14] Neary JP, Martin TP, Quninney HA. Effects of Taper on Endurance Cycling Capacity and Single Muscle Fiber Properties. Medicine Sci Sports Exerc 2003;35:1875–81. https://doi.org/10.1249/01.mss.0000093617.28237.20.